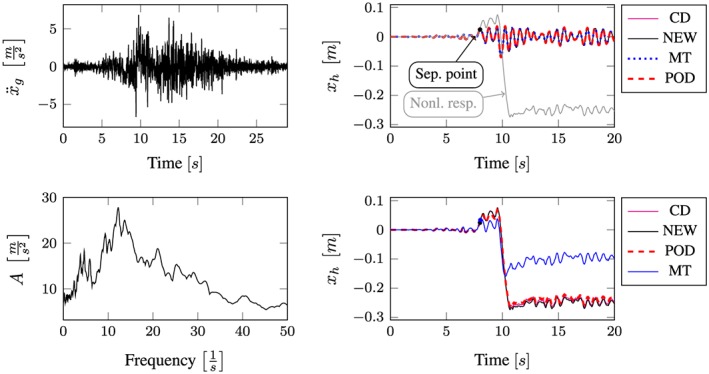
Figure 9.

Results Landers earthquake. Top left: Landers earthquake time history; bottom left: peak acceleration response spectrum ζ = 0.04; top right: linear response functions; bottom right: nonlinear response functions. [Colour figure can be viewed at wileyonlinelibrary.com]
