Figure 13.

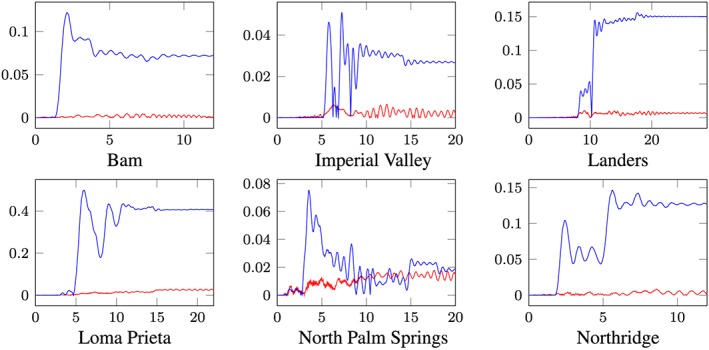
Error evaluation; x‐axes ... time [s], y‐axes ... POD error function x r,POD(t)[m] (red) and modal truncation error function x r,M(t)[m] (blue). [Colour figure can be viewed at wileyonlinelibrary.com]

Error evaluation; x‐axes ... time [s], y‐axes ... POD error function x r,POD(t)[m] (red) and modal truncation error function x r,M(t)[m] (blue). [Colour figure can be viewed at wileyonlinelibrary.com]