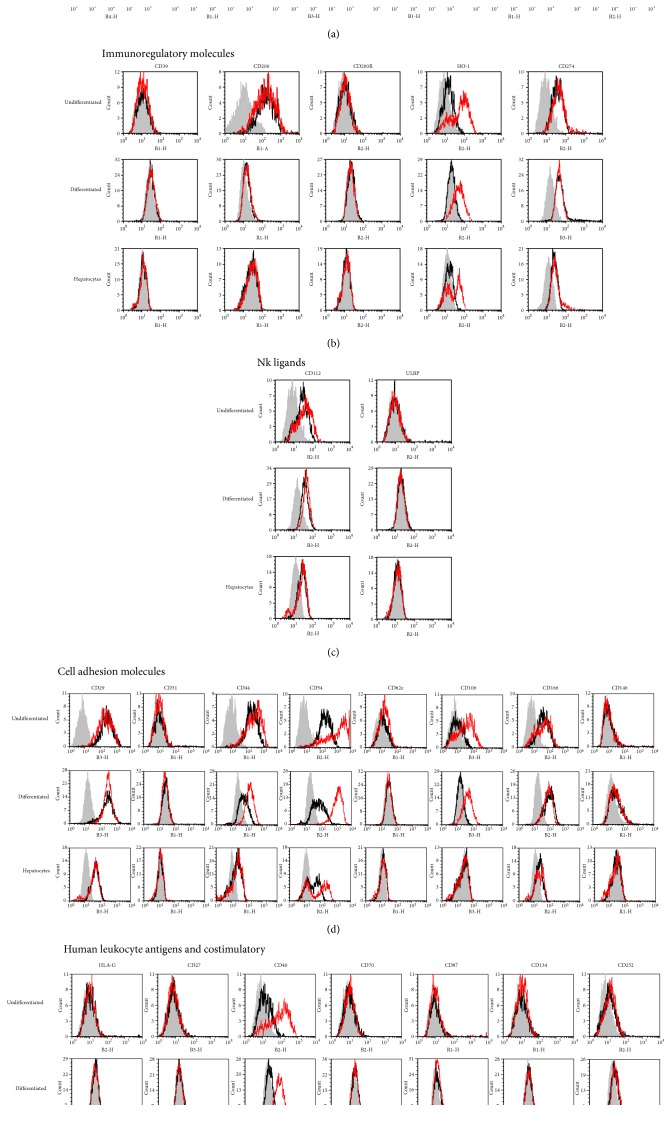
Figure 1.
Characterization of the immunoprofile of ADHLSCs and human hepatocytes. Representative FACS histograms indicate the immunoprofiling of different liver-derived cells as determined and analyzed by flow cytometry. The expression of a panel of immunological markers was evaluated in ADHLSCs before and after hepatogenic differentiation and in comparison to hepatocytes being used as standard reference. These liver-derived cells were investigated under constitutive (black curve) and inflammatory-priming conditions (red curve). The grey curve represents the antibody control. The corresponding monoclonal antibodies used for establishing this immunoprofile are listed in Table 1. The data are also presented and listed in Table 2 as the mean ± SEM percentage of each marker expression. (a) Endothelial, stromal, and embryonic markers (CD34, CD45, CD90, CD95, CD210, and CD271). (b) Immunoregulatory molecules (CD39, CD200, CD200R, CD274, and HO-1). (c) Natural killer ligands (CD112, CD155, and ULBP3). (d) Cell adhesion molecules (CD29, CD31, CD44, CD54, CD62e, CD106, CD166, and CD146). (e) Human leukocyte antigens (HLA-G) and costimulatory molecules (CD27, CD40, CD70, CD86, CD134, and CD252).

