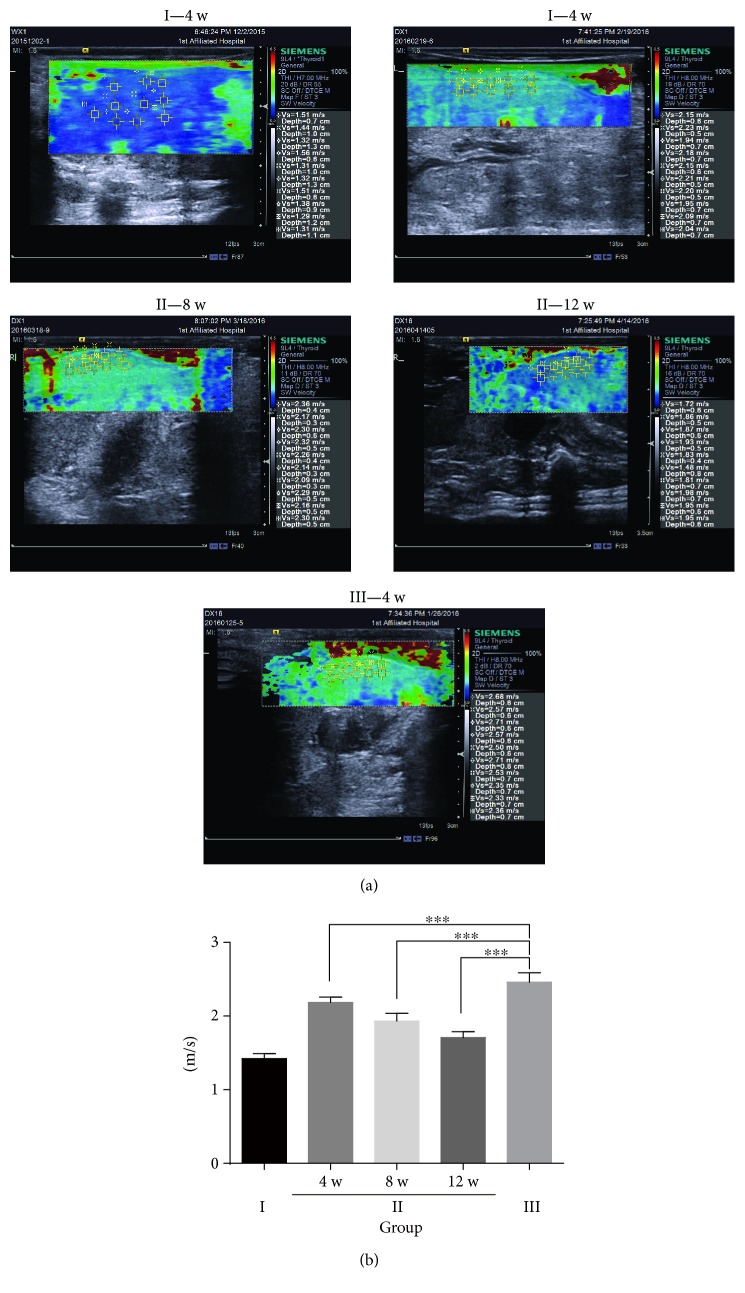
Figure 2.
Semiquantitative assessment of liver fibrosis in the different experimental groups by shear-wave elastography. (a) Representative micrograph of liver elastography in the three groups. Saline control group rats (group I), untreated fibrosis animals (group III), fibrotic animals transplanted with hPMSCs (group II) at four weeks, eight weeks, and twelve weeks after transplantation (4 w, 8 w, and 12 w). Images are representative images from n = 3 rats at each time point. The data are presented as the mean ± SD (error bars) and were statistically analyzed using one-way ANOVA.∗∗∗p < 0.001.

