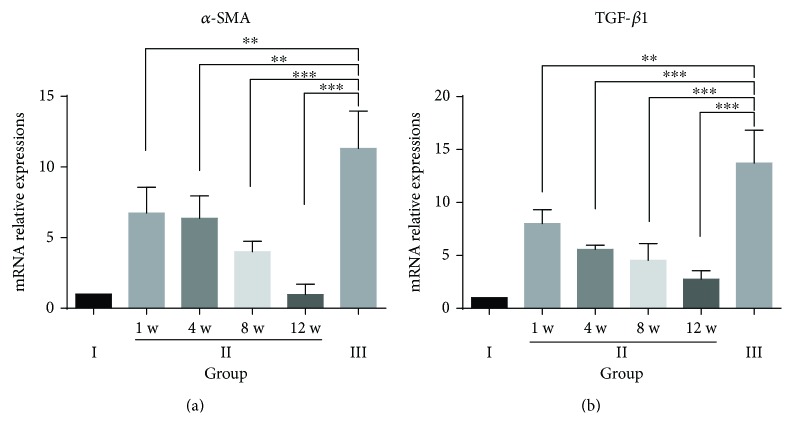
Figure 7.
Relative mRNA expression levels of α-SMA and TGF-β1 in the different experimental groups. Quantitative real-time polymerase chain reaction (qRT-PCR) results from n = 6 rats from each group at each time point. The tests were performed in triplicate. The data are presented as the mean ± SD (error bars) and were statistically analyzed using Student's t-test. ∗∗p < 0.01, ∗∗∗p < 0.001.

