Abstract
Background:
A rapid and comprehensive metabolic stability screen at the top of a drug discovery flow chart serves as an effective gate in eliminating low value compounds. This imparts a significant level of efficiency and saves valuable resources. While microsomes are amenable to high throughput automation and are cost effective, their enzymatic make-up is limited to that which is contained in endoplasmic reticulum, thereby informing only on Phase I metabolism. Lack of Phase II metabolism data can become a potential liability later in the process, adversely affecting discovery projects’ timelines and budget. Hepatocytes offer a full complement of metabolic enzymes and retain their cellular compartments, better representing liver metabolic function. However, hepatocyte screens are relatively expensive, labor intensive, and not easily automatable. Liver S9 fractions include Phase I and II metabolic enzymes, are relatively inexpensive, easy to use, and amenable to automation, making them a more appropriate screening system. We compare the data from the three systems and present the results.
Results:
Liver S9 and hepatocyte stability assays binned into the same category 70-84% of the time. Microsome and hepatocyte data were in agreement 73-82% of the time. The true rate for stability versus plasma clearance was 45% for hepatocytes and 43% for S9.
Conclusion:
In our opinion, replacing liver microsome and hepatocyte assays with S9 assay for high throughput metabolic screening purposes provides the combined benefit of comprehensive and high quality data at a reasonable expense for drug discovery programs.
Keywords: ADME, discovery, DMPK, efficiency, hepatocyte, microsome, stability, S9
1. INTRODUCTION
Absorption, distribution, metabolism, and elimination (ADME) studies in drug discovery have always played a critical role in optimizing the ‘drug-like’ properties of new chemical entities (NCE) and increased their probability of success in subsequent stages of the drug discovery process. In order to provide this valuable information in a timely manner, ADME assays have had to conform to high throughput formats, whenever possible, to keep pace with the blazing speed of high throughput medicinal chemistry (HTMC). The inherent nature of HTMC allows medicinal chemists to synthesize large numbers of NCEs that are then transferred to the discovery drug metabolism and pharmacokinetics (DMPK) groups to be evaluated for ‘drug- like’ properties. This high volume presents a challenge to discovery DMPK scientists with regard to speed of data turnaround time while maintaining quality and cost.
A reasonable discovery ADME flowchart employs more facile, actionable, and less expensive assays at the top. Such assays should be designed to weed out the inferior compounds as soon as possible while minimizing the rates of false negatives. It is then imperative that such assays be reliable, rapid, and “high content”. The first and foremost ADME screen that an NCE is typically subjected to is the metabolic stability screen. Metabolic stability is defined as the percentage of parent compound lost over time in the presence of a metabolically active test system [1]. Generally, the concept of in vitro metabolic stability derives its importance from its power to predict liver metabolic clearance in vivo. By understanding the metabolic stability of compounds early in discovery, compounds can be prioritized for progression into pharmacokinetic studies. High throughput assays to evaluate metabolic stability provide crucial data to discovery project teams and assist in developing structure-activity relationships (SAR). Metabolic stability further receives a great deal of attention in early drug discovery for the simple fact that oral dosing is by far the preferred route of administration. When a compound is administered orally, it is subjected to first-pass metabolic effect in enterocytes and more significantly in hepatocytes before it reaches the systemic circulation and eventually its target organ.
High throughput in vitro screens for drug metabolism are very effective in guiding lead optimization and preventing selection of candidates with unfavorable properties. The advantage of using these screens include: (1) they allow testing of large quantities of compounds early in drug discovery before conducting animal testing, (2) they are amenable to high throughput screening and automation, and (3) human cells or cell constituents can be used, increasing the relevance to man [2]. According to data collected by PubMed, the total number of publications per year categorized into the “in vitro drug metabolism” category increased from 10,641 in the year 2000 to 17,212 in the year 2013 [3]. However, there still remains a lack of consensus within the industry on the best representative system to use for in vitro drug metabolism screening studies. Several systems are currently in use including, recombinant enzymes, liver microsomes (LM), liver S9 fractions, and hepatocytes. Each of these systems have their pros and cons, however it is important to select a system that adequately represents both Phase I and Phase II metabolic enzymes, offers low cost, ease of use and storage, and is amenable to high throughput screening.
Liver S9 fractions (the 9000g supernatent of a liver homogenate) are not only easily obtained during the early stages of liver microsomal preparation [4, 5], but they also contain both microsomal and cytosolic fractions that can provide more metabolic information than microsomes alone. This is because microsomes lack the cytosolic enzymes. Homogenization and differential centrifugation of liver tissue enables the concentrated source of enzymes available in the S9 fraction (Fig. 1) [5]. Unlike liver microsomes, which contain only the endoplasmic reticulum subcellular fraction (containing most notably cytochrome P450’s or CYPs and Uridine 5'-diphospho-glucuronosyltransferase; UGTs), the S9 fractions further contain the cytosolic enzymes such as aldehyde oxidase, xanthine oxidase, sulfotransferases, methyltransferases, N-acetyl transferases and glutathione transferases, which have gained appreciation as major contributors for metabolism of certain chemotypes [6]. The S9 data set is therefore richer in content and provides medicinal chemists with an opportunity to stabilize compounds against both Phase I and II simultaneously. One disadvantage of S9 fractions to microsomal preparations is the inherent dilution of enzymes. However, this can simply be overcome by adjusting protein levels as presented in this work. Unlike hepatocytes, they do require exogenous cofactors such as β-Nicotinamide adenine dinucleotide phosphate-regenerating system (NADPH; Phase I oxidation), uridine 5’-diphospho-α-D-glucuronic acid (UDPGA; Phase II glucuronidation), glutathione (GSH; Phase II), and 3’-phosphoadenosine-5’-phosphosulphate (PAPS; Phase II sulfation) for activity, however they have a significant price benefit, are easy to store and use, and are much more amenable to high throughput screening. Furthermore, they do not add an additional layer of complexity (permeability across the hepatocyte cell membrane to gain access to the metabolizing enzymes) and can also be easily used in mechanistic studies with inhibitors. The disadvantages, consistent with any cell-free system, include the potential inactivation or lack of some enzymes during preparations, like flavin-monoxygenases (FMO’s), loss of cellular compartmentalization and the need for cofactors to be added during incubation. 7-Ethoxycoumarin (7-EC) is metabolized by many cytochrome P450 enzymes and has been used as a prototypic substrate to monitor P450 activity in both hepatic and extrahepatic tissue [7] and can be used as a measure of catalytic activity. The human S9 pools are derived from large numbers of donors with a range of protein concentrations (20-30 mg/ml protein content) and with a range of catalytic 7-ethoxycoumarin O-deethylase (ECOD) activity (55-105 pmol/mg protein/min). These values correlated well with functional P450 activities and those reported in primary cultures of human hepatocytes obtained from liver samples [7]. This is generally referred to as ECOD enzyme characterization and can be used to compare lots of S9 fractions in human and most animal species.
Fig. (1).
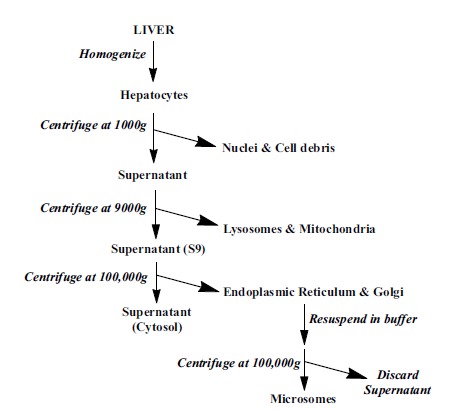
Preparation of liver subcellular fractions.
For about a decade, we have utilized the liver S9 system as our primary in vitro screen to ‘weed out’ compounds with poor metabolic stability and poor probability of success [8]. In order to further solidify the selection of liver S9 fractions as our system of choice for metabolic stability evaluations, we conducted a retrospective analysis comparing the results from our liver S9 assay to our hepaotocyte assay (the gold standard in representing the in vivo conditions). In addition, for comparison purposes we also calculated in vitro half lives for a subset of compounds using the liver microsomal metabolic stability assay (t1/2) – a staple in the phar- maceutical industry. Our results demonstrated that liver S9, using our methodology, was a robust in vitro system that provides the same quality of data as hepatocytes but does so in a much more efficient, high throughput, and cost-effective manner. Furthermore, the microsomal timecourse assay (t1/2) did not offer any selection advantage over the S9 assay for the compounds tested. Also, microsomes were not informative to the medicinal chemists as to the nature of biotransformation and multitude of softspots prone to Phase II metabolism during SAR.
2. MATERIALS AND METHODs
2.1. Hepatocyte Metabolic Stability Assay
Cryopreserved rat hepatocytes (Sprague Dawley; male; pooled) and human hepatocytes (20-donor & gender pooled) were purchased from BioreclamationIVT (Baltimore, MD., USA). Hepatocyte incubations were performed in Krebs-Henseleit buffer (KHB; Sigma Aldrich; Cat # K3753), pH 7.4 with 1x10⁶ hepatocytes/mL (viability > 80%), in triplicate for each species, and substrate concentration of 3 µM. The incubations were carried out in a 37°C, 5% CO2 incubator for one hour. Cryopreserved hepatocytes were quickly thawed in a 37°C water bath and then added to conical tubes containing warm hepatocyte thawing medium. Tubes were gently inverted to produce a homogeneous cell suspension before being centrifuged at 60g for five minutes at room temperature. The supernatant was removed and the cell pellet was resuspended in warm KHB. Suspended hepatocytes were transferred to 48-well incubation plates and spiked with test compound. The reactions were stopped at 0 and 60 minutes with the addition of two volumes of ice cold 50:50 acetonitrile:methanol (ACN:MeOH). 7-EC was used as a positive control for all hepatocyte assays. The supernatants were analyzed by liquid chromatography-tandem mass spectrometry (LC-MS/MS) for the amount of parent compound remaining.
2.2. Liver S9 Metabolic Stability Assay
Both human (gender pooled, 10 individuals) and rat (Sprague Dawley; male; pooled) liver S9 fractions were purchased from BD Biosciences (San Jose, CA., USA). It has been demonstrated by Otwell et al., [10] that several Phase I and Phase II enzymes retain their activity, when stored at -70oC for up to 10 years and up to 10 freeze/thaw cycles. Furthermore, our internal data from several different S9 lots has also demonstrated comparable Phase I and Phase II activities (as evaluated using 7-EC as a control) for the lifetime of the lot. The incubation conditions were developed by using four commercial compounds, 7-EC, diclofenac, 4-nitrocatecal, and phenolphthalein with known metabolic profiles (both Phase I and II metabolism). The rat and human S9 protein concentration and the cofactor concentrations were optimized to match the results of hepatocyte stability, quantitatively. The Phase I and Phase II metabolites; 7-hydroxycoumarin (7-HC), 7-HC sulfate, 7-HC glucuronide, 4-hydroxydiclofenac (4-HD), 4-HD glucuronide, diclofenac acyl glucuronide, 4-nitrocatechol sulfate (4-NC sulfate), and phenolphthalein glucuronide were also monitored. The identity of each of the metabolites was assessed by comparison of their retention time and mass spectra with those of authentic standards. Each new lot of S9 goes through this optimization process before being used for high throughput compound screening in the discovery DMPK flowchart. A cocktail of four activating cofactors was used in order to stimulate Phase I (NADPH), and Phase II (UDPGA, PAPS, GSH) metabolism. The final concentrations of NADPH, UDPGA, and GSH were 1, 0.5 and 2.5 mM, respectively while that of PAPS was 0.05 mg/mL.
Tris buffer was prepared as a 200 mM solution containing 2mM magnesium chloride (included MgCl2 as a source for Mg+2 ions to stimulate CYP activity) in deionized water and adjusted with 1 M NaOH to pH 7.4. Stock reference solutions (7-EC as the positive control) and test compounds were prepared at 5 mM concentration in DMSO, and then diluted to 0.3 mM with ACN prior to use. NADPH, UDPGA, and GSH solutions were prepared at 40, 20 and 2 mM, respectively while PAPS was prepared at 2 mg/mL, all in tris buffer prior to mixing together in a 1:1:1:1 ratio for use. S9’s were preincubated with test compound for 5 minutes at 37°C in tris buffer, pH 7.4, and then the reactions were initiated by adding the cofactor mixture. At two time points, zero and sixty minutes, aliquots of the sample mixture were removed and quenched by addition of two volumes of ice cold 50:50 ACN:MeOH. The plate of quenched samples was then centrifuged at 4000g for 10 minutes to sediment the precipitated proteins before injection onto LC-MS/MS for analysis of parent compound remaining. Percent of the parent compound remaining is calculated by comparing peak areas.
2.3. Liver Microsomal Metabolic Stability Assay
Both human (gender pooled, 10 individuals) and rat (Sprague Dawley; male; pooled) liver microsomes were purchased from BD Biosciences (San Jose CA., USA). The incubation mixtures were prepared in 96-well plates and contained 3 µM test compound, rat or human liver microsomes at 0.5 mg of microsomal protein/mL, 2 mM MgCl2, and 200 mM Tris buffer, pH 7.4, in a final volume of 500 µL. Reactions were initiated by the addition of NADPH (final concentration of 1mM), and the plates were kept in a Dubnoff shaking water bath at 37°C. Immediately after the addition of NADPH, a t = 0 aliquot (100 µL) was withdrawn and further samples were withdrawn at 10, 20, 40, and 60 minutes. At each timepoint, the reactions were immediately terminated by adding 200 µL of ice cold ACN:MeOH. The samples were centrifuged for 10 minutes at 4000g to pellet the precipitated microsomal protein, and the supernatant was analyzed via LC-MS/MS. Using the t = 0 peak area as 100% the percentage remaining was calculated. For each compound, the log percentage remaining versus incubation time was plotted and the slope of this linear regression (-k) was converted to an in vitro t1/2 value using the equation listed below.
t1/2 = -0.693/k
2.4. Caco-2 Permeability Assay
A ready-to-use cell culture system that provides a 21-day cell barrier in integrated HTS Transwell®-24 plates purchased from ADMEcell was used for the Caco-2 assay. Polarized cultures of Caco-2 cells were provided on polycarbonate micro-porous filters in HTS Transwell® plates (6.5mm diameter, 0.33cm2 area and 0.4µm pore diameter). The transport medium used for the permeability studies was Hank’s balanced salt solution (HBSS; Invitrogen; Cat # 14185052) buffer containing 1.1 mM magnesium chloride, 1.3 mM calcium chloride and 5 mM D-glucose. Prior to the experiment, each monolayer was washed twice with warm buffer. The concentration of test compound in this assay was 10 µM and all measurements were performed in duplicate. Lucifer yellow served as a quality control check for monolayer integrity of all wells and three control compounds were run with each assay (Atenolol, Propranolol, and Vinblastine). Studies were initiated by adding an appropriate volume of buffer containing test compound to either the apical or basolateral side of the monolayer. The monolayers were placed into a standard cell culture incubator (5% CO2, 37°C) for two hours. Samples were taken from both the apical and basolateral compartments at the end of the two hour incubation and compound concentration was analyzed by LC-MS/MS. Permeability of compounds was determined as the coefficient of apparent permeability (Papp, measured in cm/s) calculated according to the following formula:
Papp = dQ/ (dt·A·C0),
where dQ/dt is the amount of compound present in the receiver compartment as a function of time; A is the area of the Transwell (cm2); and C0 is the initial concentration of compound applied in the donor compartment.
2.5. LC-MS/MS Analysis
Diluted supernatants from the stability assays were injected onto a C18 ultra high performance liquid chromatography (UPLC) column, and test compounds and control were eluted using a generic reverse-phase UPLC method. Acetonitrile with 0.1% formic acid (organic) and water with 0.1% formic acid (aqueous) were used as the typical mobile phases, where separation was achieved using a gradient from 5% organic to 90% aqeuous. The test compounds and controls were quantified on either a AB Sciex 4000 QTRAP® LC-MS/MS system or a Thermo Scientific TSQ Quantum Ultra™ Triple Quadrupole Mass Spectrometer by multiple reaction monitoring (MRM) in positive ion electrospray mode using predetermined parent/product mass transition ion pairs. The amount of test compound observed at sixty minutes was divided by that observed in the zero minute sample, and this value was converted to a percentage and reported as “% remaining at 60 min”.
3. RESULTS and DISCUSSION
Since hepatocytes are considered the gold standard and the most physiologically relevant system, we thought it would be more informative to compare the two in vitro systems in question (microsomes and S9) to the gold standard to evaluate which one represents hepatocytes better. Comparing microsomes to S9, in our opinion, will not provide any meaningful conclusions as to which system is more similar to hepatocytes. In addition, a graph of S9 data vs microsome data will lack a reference/anchor point to define what is an acceptable value. Graphing the two assay results individually against hepatocyte data (gold standard) provides the hepatocyte results as the anchor which the other 2 systems are supposed to emulate.
We conducted a head-to-head comparison of the rat and human S9 stability results to the corresponding hepaotocyte stability (the gold standard) results for a test set of 456 internal compounds from several different chemical templates. In doing so, we used the “70% remaining at 60 minutes” criteria post-incubation as listed in our prior publication [8]. Compounds with ≥ 70% parent remaining at 60 minutes were labeled as “pass” and the remaining were labeled as “fail”. The results of this analysis are shown in Fig. 2. About 70% of cases, the rat S9 and hepatocyte data were in agreement – both assays binned the compound in the same category. This rate was 84% for human S9 and hepatocytes. The compounds that passed S9 but failed in the hepatocyte assay amounted to 11% in rat and 5% in human. On the other hand, the compounds that failed S9 but passed in the hepatocyte assay amounted to 20% in rat and 11% in human. This argues that hepatocytes are significantly more permissive than S9 fractions in allowing compounds to progress into animal studies. Upon further investigation, it was determined that one reason for such high rate of acceptance by hepatocytes may have been the poor permeability exhibited by these compounds. Poor permeability would potentially lead to higher apparent rates of stability in hepatocytes, owing to their inability to enter the hepatocytes to be exposed to the metabolic enzymes. Indeed, we found that 75% of compounds that fell into this category and had Caco-2 data, exhibited poor permeability according to the permeability criteria that we have published previously [8] (Papp < 8 X 10⁻⁶ cm/s). Excluding such compounds from the analysis, the discrepancy between S9 and hepatocyte acceptance rate dropped to 13% in the rat (from 20%) and 7% in the human S9 (from 11%). While one might view the fact that S9 fractions are more prohibitive than hepatocytes in allowing advancement of such compounds, some of the anxiety about this will be off-set by allowing the more promising compounds, as judged by potency and selectivity, to advance into in-vivo studies on a case-by-case basis to ensure that highly desirable compounds are given a fair chance in the drug discovery process. After all, the S9 assay is intended to be a high throughput screen.
Fig. (2).
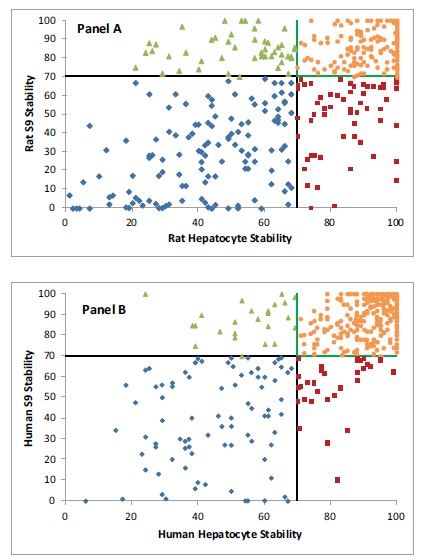
Binning of 456 compounds into four quadrants based on their rat S9 and hepatocyte stability (Panel A) and human S9 and hepatocyte stability (Panel B). ● = Compound with good S9 and hepatocyte stability (rat = 185 compounds; human = 300 compounds). ♦ = Compound with poor S9 and hepatocyte stability (rat = 132 compounds; human = 84 compounds). ▲ = Compound with good S9 stability but poor hepatocyte stability (rat = 49 compounds; human = 24 compounds). ■ = Compound with poor S9 stability but good hepatocyte stability (rat = 90 compounds; human = 48 compounds).
A similar analysis was carried out comparing the liver microsomal assay data (t1/2) and the hepatocyte stability data for a subset of randomly selected compounds (n = 22). We conducted 60 minute time course experiments for these compounds using liver microsomes and binned them based on a 30 minute cut-off criteria (Fig. 3). Compounds with in vitro microsomal half lives < 30 min were binned as unstable and those with in vitro microsomal half lives ≥ 30 min were binned as stable [9]. About 82% of cases, the rat liver microsomes and hepatocyte data were in agreement – both assays binned the compounds in the same categories. This rate was 73% for human liver microsomes and hepatocytes. These percentages were quite similar to those seen in the S9 vs hepatocyte comparison in these two species, arguing that both systems are equally efficient in binning compounds. However, the metabolic profiles obtained with liver microsomes may not be an accurate representation of the metabolism encountered in hepatocytes or in vivo because, as mentioned earlier, S9 fractions account for Phase I and Phase
Fig. (3).
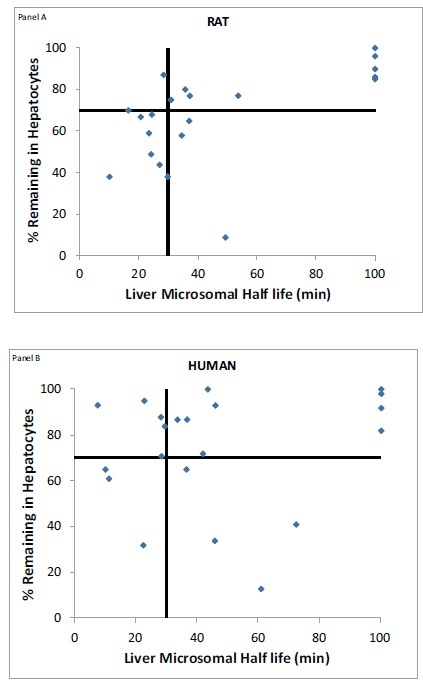
Binning of 22 compounds into four quadrants based on their rat liver microsomal half-lives and hepatocyte stability (Panel A) and human liver microsomal half-lives and hepatocyte stability (Panel B).
II metabolism whereas liver microsomes account only for Phase I. We have come across many examples in our laboratory where Phase II conjugations were the predominant metabolic pathway for compounds (structural data not shown). This would have been completely missed if we had used liver microsomes. By using S9 fractions, medicinal
chemists were able to optimize compounds against both Phase I and Phase II metabolic soft spots. Another significant benefit lies in the fact that instead of conducting the entire time course with microsomes (5 timepoints; an extensively used high throughput assay in the pharmaceutical industry), we reached the same conclusions regarding stability using only 2 timepoints (t = 0 and 60 min) with the S9 fractions. This constitutes a significant saving of time and resources (materials, mass spectrometer time, etc.) when one screens 100’s of compounds per week.
Next, we analyzed the relevance of S9 fraction and hepatocyte stability assays to in vivo plasma clearance prediction. We have previously reported on our in vivo cut-off criteria in the DMPK workflow [8]. This includes 43 mL/min/kg for in vivo rat plasma clearance. Herein, we carried out a retrospective analysis for rat hepaotocyte stability versus rat plasma clearance (Fig. 4). Using a cut-off value of 70% remaining at 60 minutes for rat hepatocyte stability, the true rate (45%; true positives + true negatives) was almost identical to what we had seen previously with the rat S9 (43%) [6].
Fig. (4).
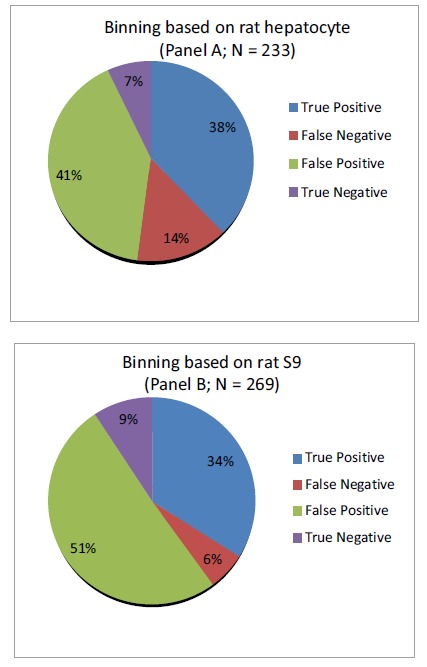
Binning of compounds based on rat plasma clearance prediction by rat hepatocyte metabolic stability (Panel A; N = 223 compounds) or rat S9 metabolic stability (Panel B; N = 269 compounds) data. The metabolic stability and rat plasma clearance cutoff’s were at 70% remaining at 60’ and 43 mL/min/kg, respectively [7]. True positive = Compound with good stability and low plasma clearance. True negative = Compound with poor stability and rapid plasma clearance. False positive = Compound with good stability but rapid plasma clearance. False negative = Compound with poor stability but low plasma clearance.
The false positive rate (compounds that are stable in the in vitro screen but have rapid plasma clearance) was higher with rat S9 (51%) when compared to rat hepatocytes (41%). However, the false negative rate (compounds that appear unstable in the in vitro screen but in reality have acceptable plasma clearance values) was lower with the rat S9 system (6%) compared to the hepaotocyte system (14%). This suggested that both systems performed equally well when predicting the true rate and even though the S9 system put a slight strain on the resources (due to higher false positives) it prevented a significant number of good compounds from being discarded. A qualitative analysis was performed for comparison of metabolites generated from rat and human hepatocytes versus S9 fractions. Under the optimized S9 assay conditions the metabolite profiles (both Phase I and II) for the four commercial control compounds were consistent with the metabolite profiles generated by the hepatocyte system for both species (rat and human). Using 7-EC as an example, in the time zero samples only 7-EC is present, however for the 60 minute samples we detected the three expected metabolites of 7-EC, 7-HC, 7-HC glucuronide, and 7-HC sulfate. Data for 7-EC and its Phase I and Phase II metabolites are shown in (Table 1) and (Fig. 5).
Table 1.
7-EC and its metabolites generated in both rat and human microsomes, S9 fractions, and hepatocytes. Metabolically the S9 fractions are more representative of the hepatocytes than microsomes; phase I metabolite 7-HC is present in all three systems in both species, however phase II metabolites 7-HC glucuronide and 7-HC sulfate are only present in S9 and hepatocyte.
| Rat | ||||
|---|---|---|---|---|
| Compound | Microsome | S9 | Hepatocyte | |
| 7-HC | ✓ | ✓ | ✓ | |
| 7-HC Glucuronide | ✓ | ✓ | ||
| 7-HC Sulfate | ✓ | ✓ | ||
| Human | ||||
| Compound | Microsome | S9 | Hepatocyte | |
| 7-HC | ✓ | ✓ | ✓ | |
| 7-HC Glucuronide | ✓ | ✓ | ||
| 7-HC Sulfate | ✓ | ✓ | ||
Fig. (5).
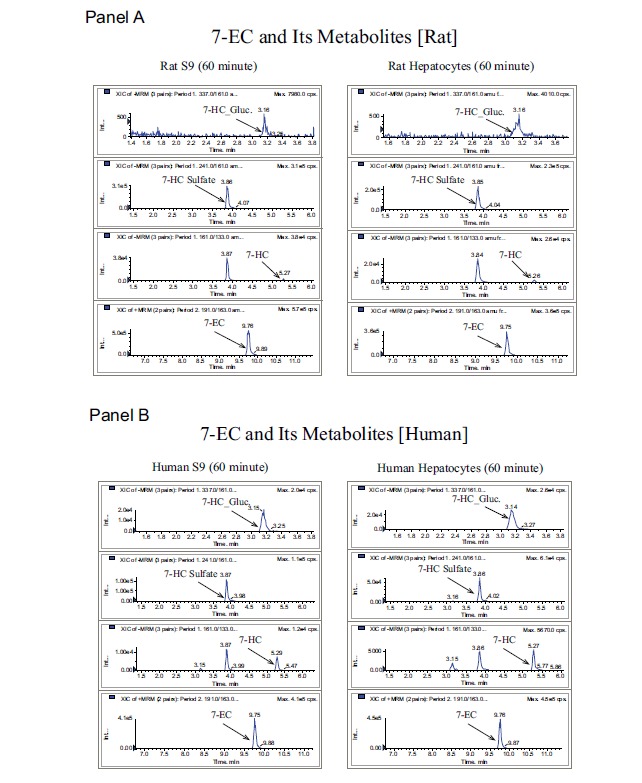
7-EC and its metabolites generated in both rat (Panel A) and human (Panel B) S9 fractions and hepatocytes.
Lastly, we did a cost-benefit analysis of the S9 versus the hepaotocyte stability assays. Not surprisingly, the rat hepaotocyte assay turned out to be 5-fold more expensive compared to the rat S9 assay. In human, the difference was even more pronounced with the human hepatocyte assay costing 21-fold more when compared to the human S9 assay. Of course, hepatocyte assays tend to have slower turnaround time, which is costly to discovery project timelines. Combined together, the S9 assays can be performed at a 15-fold savings when compared to the corresponding hepatocyte assays without compromising on the data quality while significantly improving the throughput and efficiency.
CONCLUSION
Discovery flow charts utilize effective and decision-making screens with appropriate acceptance criteria for rapid progression of compounds with ‘drug-like’ properties. A rapid, high throughput and comprehensive metabolic stability screen at the top of a discovery flow chart can serve as an effective gate in eliminating low value compounds. Historically liver microsomes and hepatocytes have been employed as metabolic stability screens but these have their limitations. Microsomes have a limited enzymatic make-up whereas hepatocytes are cost-prohibitive, labor extensive and not highly amenable to automation. Liver S9 addresses drawbacks associated with microsomes and hepatocytes and offers a more appropriate screening tool.
Our analysis demonstrates that liver S9 is a robust in vitro system that provides the same quality of data as hepatocytes, the gold standard, and does so in a much more efficient and cost-effective manner. Replacing liver microsomal and/or hepatocyte stability assay in discovery DMPK with high throughput liver S9 assay provides a more comprehensive data set, adds to the quality and prevents the high cost of using hepatocytes in drug discovery. We have implemented this S9 assay at the top of our discovery DMPK workflow and it has enabled us to ramp up our metabolic screening throughput greatly without excessively impacting our budget and compromising the data quality.
ACKNOWLEDGEMENTS
We sincerely thank Jason Katz for his technical and scientific contribution to this research. We would also like to thank the Celgene Medicinal Chemistry department for providing all the internal compounds used for this manuscript.
CONFLICT OF INTEREST
The authors have no conflict of interest and no payment has been received in the preparation of this manuscript. All authors were employees of Celgene at the time of writing this manuscript.
REFERENCES
- 1.Ackley D.C., Rockich K.T., Baker T.R. Metabolic Stability Assessed by Liver Microsomes and Hepatocytes. In: Yan Z., Caldwell G.W., editors. Methods in Pharmacology and Toxicology Optimization in Drug Discovery (In vitro methods). New Jersey: Humana Press Inc.; 2004. pp. 151–164. [Google Scholar]
- 2.Plant N. Strategies for using in vitro screens in drug metabolism. Drug Discov. Today. 2004;9(7):328–336. doi: 10.1016/s1359-6446(03)03019-8. [DOI] [PubMed] [Google Scholar]
- 3.National Library of Medicine National Institutes of Health.
- 4.Li A.P. Screening for human ADME/TOX drug properties in drug discovery. Drug Discov. Today. 2001;6:357–366. doi: 10.1016/s1359-6446(01)01712-3. [DOI] [PubMed] [Google Scholar]
- 5.Moghaddam M.F. Metabolite Profiling and Structural Identification. In: Gad S.C., editor. Preclinical Development Handbook. New Jersey: John Wiley & Sons, Inc.; 2008. pp. 937–974. [Google Scholar]
- 6.Guengerich F.P. Analysis and Characterization of Enzymes. In: Hayes A.W., editor. Principles and Methods of Toxicology. New York: Raven Press; 1989. pp. 777–813. [Google Scholar]
- 7.Serralta A., Donato M.T., Orbis F., Castell J.V., Mir J., Gomez-Lechon M.J. Functionality of cultured human hepatocytes from elective samples, cadaveric grafts, and hepatectomies. Toxicol. In Vitro. 2003;17(5-6):769–774. doi: 10.1016/s0887-2333(03)00122-x. [DOI] [PubMed] [Google Scholar]
- 8.Kulkarni A., Riggs J., Phan C., Bai A., Calabrese A., Shi T., Moghaddam M.F. Proposing advancement criteria for efficeint DMPK triage of new chemical entities. Future Med. Chem. 2014;6(2):131–139. doi: 10.4155/fmc.13.190. [DOI] [PubMed] [Google Scholar]
- 9.Li C-M., Lu Y., Narayanan R., Miller D., Dalton J. Drug Metabolism and Pharmacokinetics of 4-Substituted Methoxybenzoyl-aryl-thiazoles. Drug Metab. Dispos. 2010;38(11):2032–2039. doi: 10.1124/dmd.110.034348. [DOI] [PubMed] [Google Scholar]
- 10.Otwell C.J., Woodworth Z., Buckley D. Poster Session; 10th International ISSX Meeting; Toronto, Canada. 2013. [Google Scholar]


