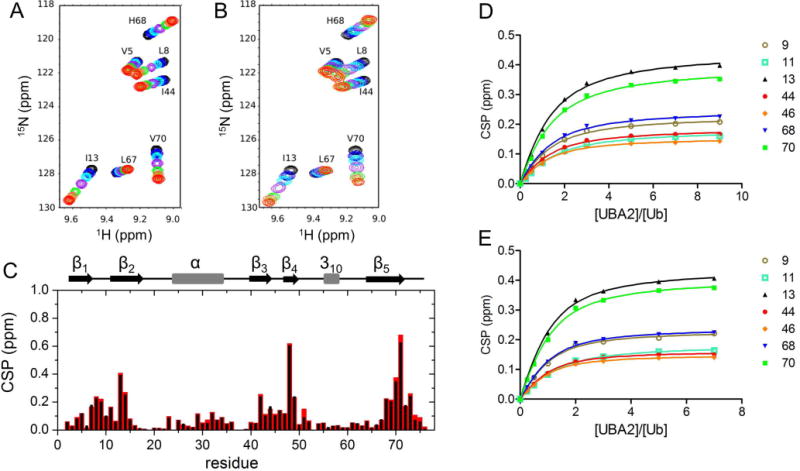
Figure 2. Ub-UBA2 titration monitored by 1H,15N-HSQC.

A, B) Overlay of portions of 15N-Ub spectra collected in buffer without (A) and with (B) 200 g/L Ficoll, upon successive additions of UBA2. The displayed spectra correspond to UBA2/Ub molar ratios of 0 (black), 0.25 (blue), 0.5 (cyan), 1 (purple), 2 (green), 3 (tomato), 5 (orange), 7 (red). C) Plot of the chemical shift perturbation (CSP) data from 1H,15N-HSQC spectra of [15N]Ub in the presence of 7-fold molar excess UBA2 with respect to free [15N]Ub, in the absence (black) and presence (red) of 200 g/L Ficoll. D,E) Ub/UBA2 binding isotherms for selected Ub residues based on CSP data collected in buffer without (D) and with (E) 200 g/L Ficoll. Residue numbers are indicated in the legend.
