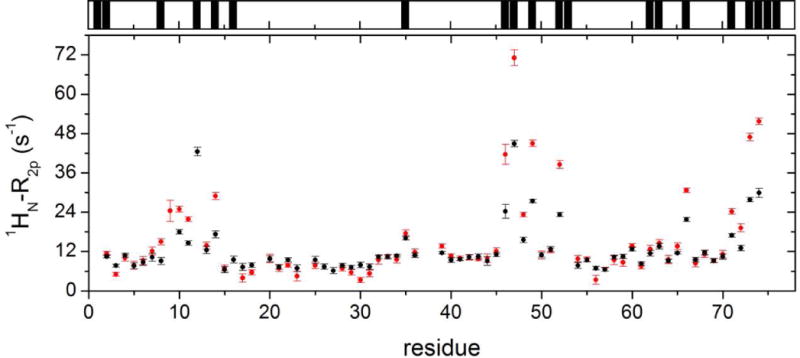
Figure 3. Solvent PRE on Ub.

Main panel: 1HN-R2p rates of Ub in phosphate buffer solution without (black) and with 200 g/L Ficoll (red). Top panel: black bars indicate Ub residues whose backbone nitrogen atoms display significant (> 0.3 Å2) solvent accessible surface area (calculations performed using the software GetArea [61] with the protein structure, PDB: 1ubq [62]).
