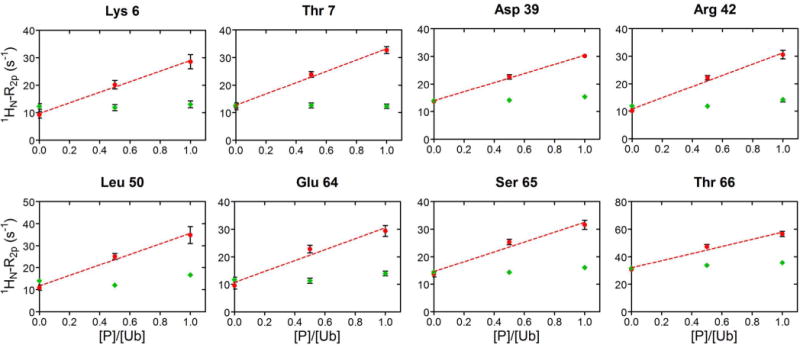
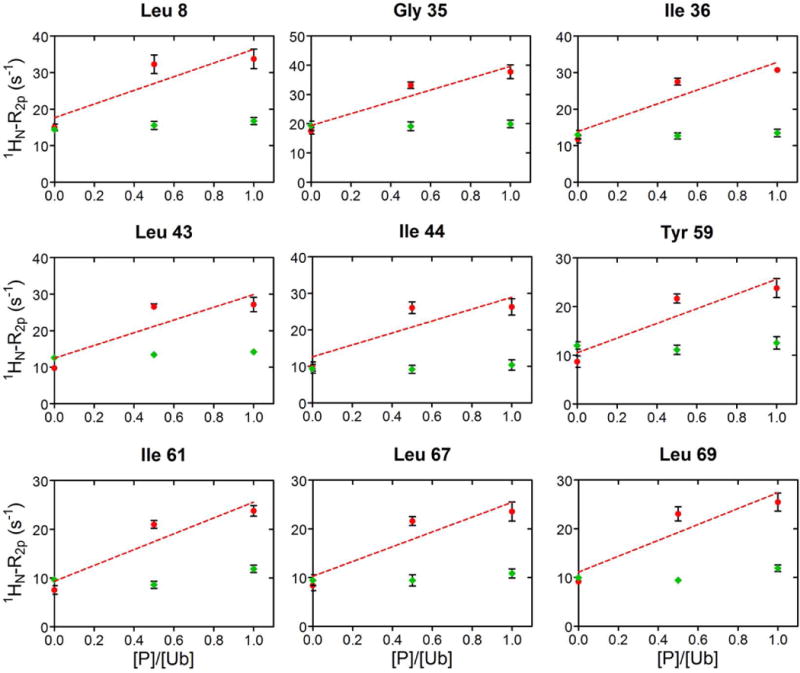
Figure 4. Solvent PRE on Ub upon UBA2 addition.


A) In red, 1HN-R2p rates of a representative group of Ub residues, that increase linearly by addition of UBA2 to Ub. The dashed line corresponds to the least-squares linear fit over three experimental points. As control, 1HN-R2p rates measured upon addition of GB1 to Ub, are reported in green. Rates are plotted versus the protein/Ub molar ratio. B) 1HN-R2p rates of representative Ub residues, whose value at 1:0.5 was above the linear trace connecting points 1:0 and 1:1, are shown in red. The dashed line corresponds to the least-squares linear fit over three experimental points. 1HN-R2p rates measured upon addition of GB1 to Ub are shown in green. Rates are plotted versus the protein/Ub molar ratio.
