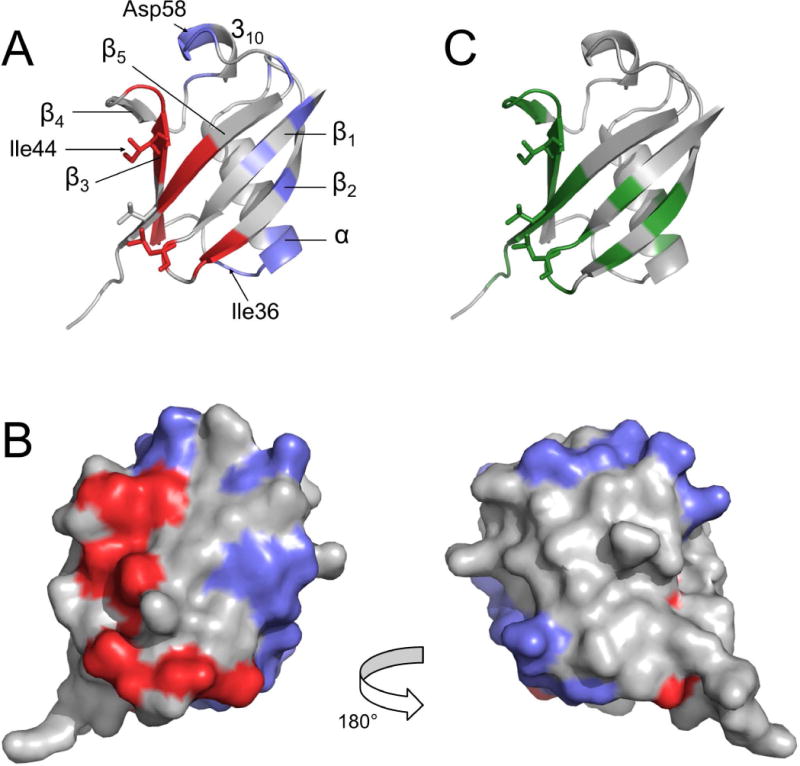
Figure 5. Mapping of interaction surfaces on Ub.

Surface residues (1HN-R2p(0) > 8 s−1) displaying Δ/σΔ > 2 are mapped onto the Ub structure (PDB: 1ubq [62]), represented with a ribbon (A) or surface (B) models; two groups are identified: the red area surrounding the Ile44 patch and the blue surfaces comprising the additional contact sites. C) CSP mapping: Ub residues displaying CSP > 0.1 ppm upon addition of a seven-fold molar excess of UBA2 are colored in green. All data refer to experiments performed in 200 g/L Ficoll solution. Residues Leu8, Ile44, and Val70, belonging to the canonical Ile44 patch, are represented in sticks in panels A and C.
