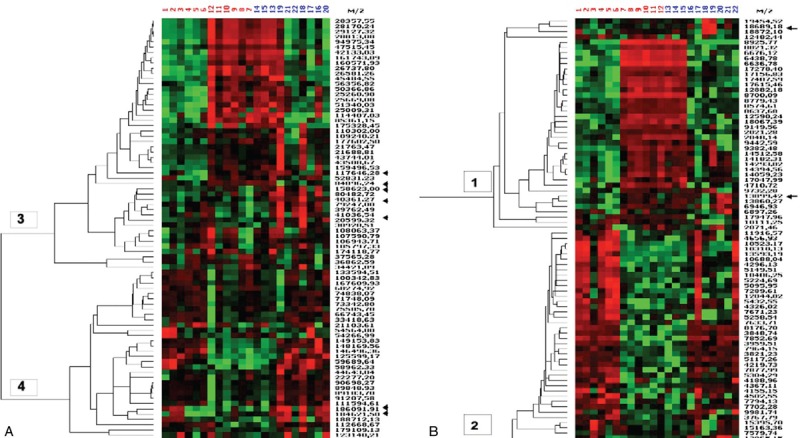
Figure 3.

Heat map represents the relative expression of proteins in the serum samples of aPL-negative (numbers 1–12) and aPL-positive (numbers 13–22) women. Red represents overexpression, and green represents downregulated expression. Arrows identify the differentially expressed proteins. (a) Heat map for small proteins (2000–20,000 Da) and (b) heat map for large proteins (20,000–200,000 Da)
