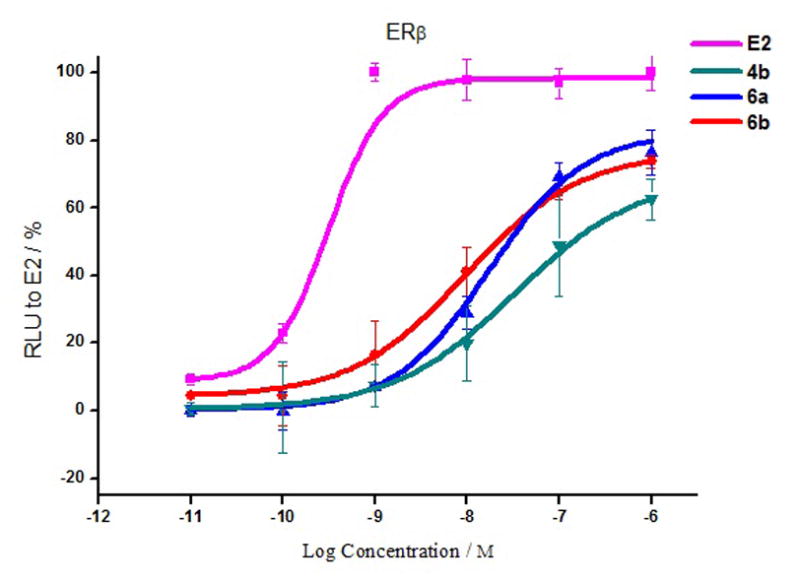
Figure 5.

Illustrative dose-response curves for the ERβ agonist effects of E2, and three selenophene-core compounds 4b, 6a and 6b. Efficacy values (given in Table 3) are the mean ± SD from three experiments. For details, see the Experimental Section.
