
Figure 2.
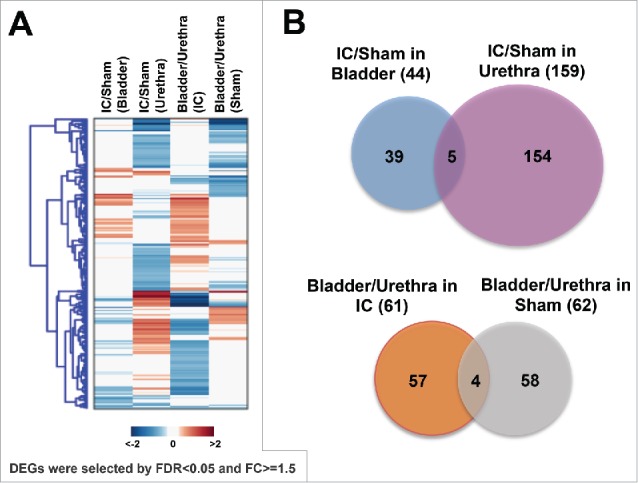
Identification of differentially expressed genes (DEGs) in bladder or urethra obtained from IC rats compared with sham controls. (A) A heatmap showing DEGs (B) Diagrams indicating IC-specific DEGs in bladder or urethra (upper), and bladder- or urethra-specific DEGs associated with IC (bottom).