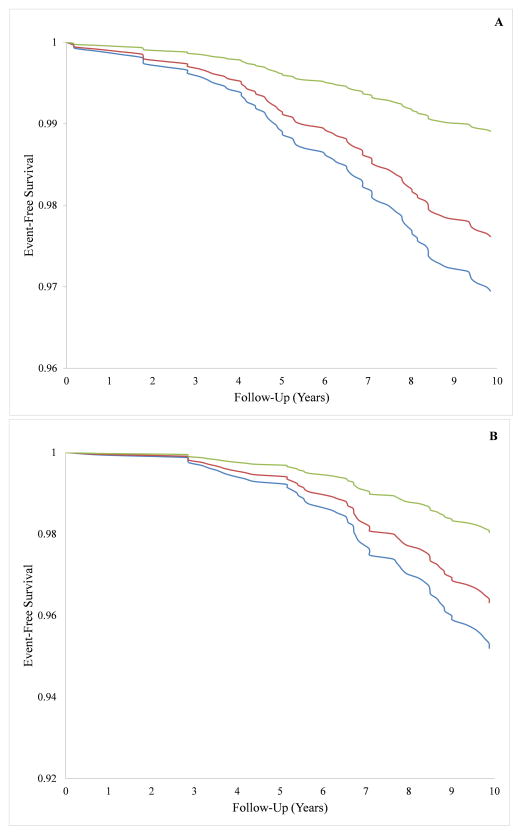
Figure 2.
Cumulative consumption of artificially-sweetened soft drinks and event-free survival of incident (a) all stroke and (b) all-cause dementia. Green, red and blue lines denote intake of <1/week, 1–6/week, and ≥1/day, respectively. Incidence curves are adjusted for age, sex, and total caloric intake (as well as education for dementia as an outcome).

