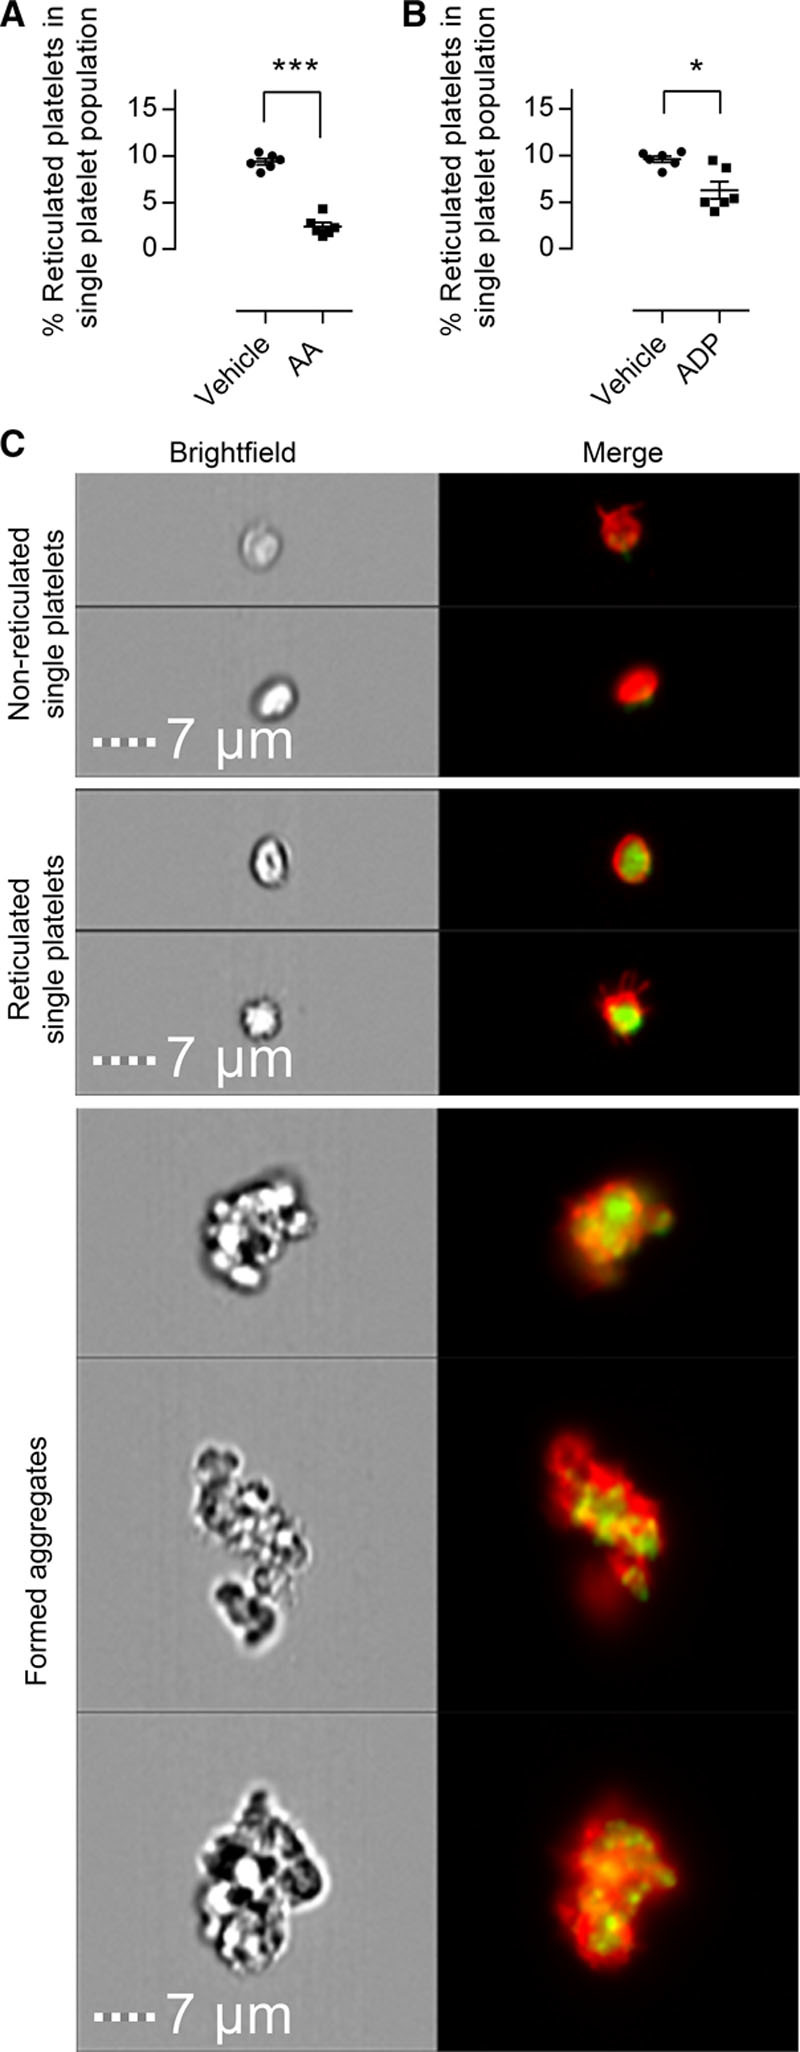
Figure 4.

Reticulated platelets display elevated reactivity in response to both arachidonic acid (AA) and ADP. The proportion of reticulated platelets among nonaggregated platelets was assessed by flow cytometry in platelet-rich plasma incubated with vehicle, (A) AA, or (B) ADP. C, Representative flow cytometric images of nonreticulated and reticulated (mRNA stain green) single platelets (red), as well as aggregates formed in response to ADP. Scale bars, 7 μm. Data presented as individual data points with overlaid mean±SEM and compared by paired t test (n=6; *P<0.05, ***P<0.001).
