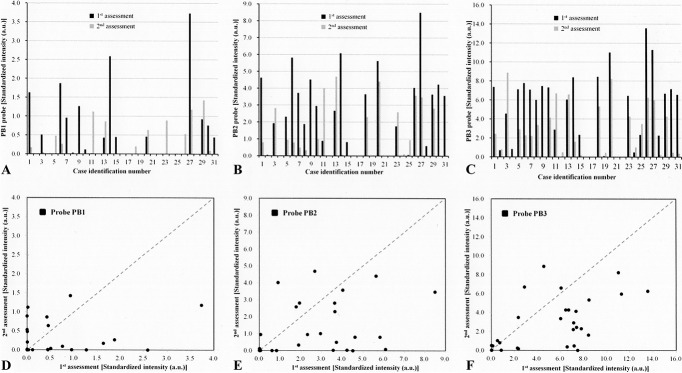
FIG. 2.
(A–C) Standardized hybridization intensities of individual samples with each of the three universal bacteria probes (PB1, PB2, and PB3) for preforewarning (first) assessment and postforewarning (second) assessment. (D–F) Changes in the bioburden before and after forewarning for each participant according to the signals of probes PB1, PB2, and PB3. Dots behind the diagonal dashed line suggest decreased bacterial contamination after forewarning, and those above the line suggest that contamination increased after forewarning.

