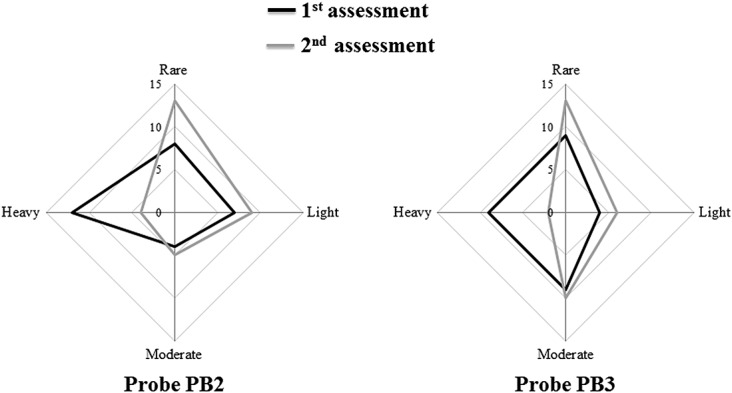
FIG. 4.

Severity of contamination determined by the standardized hybridization cutoff intensities of probes PB2 and PB3. Radar plots show the population shifts in contamination severities after forewarning. There were significant changes for both probes (P<0.001, PB2, and <0.0001, PB3) by the chi-square test.
