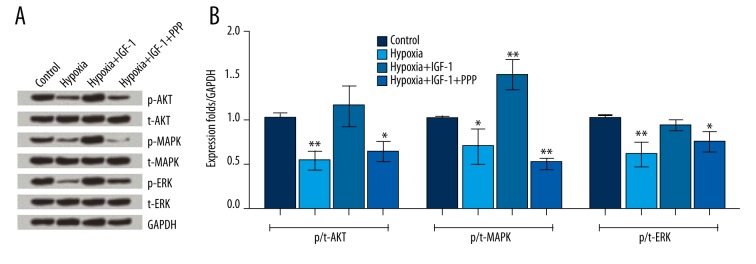
Figure 4.
Insulin growth factor 1 (IGF-1) activated the phosphatidylinositol-3-kinase (PI3K)/AKT and the mitogen-activated protein kinase/extracellular signal-regulated kinase (MAPK/ERK) signaling pathways. Neural stem cells (NSCs) were divided into four groups: the Control, Hypoxia, Hypoxia+IGF-1, and Hypoxia+IGF-1+PPP groups. (A) Protein expression levels of kinases were assayed by Western blot analysis. (B) The band intensity was assessed by Image Lab™ Software. The phosphorylation rate was expressed as the relative intensity of phosphorylated kinases/kinases, and the final results were normalized by GAPDH. Data presented are the mean ±SD of three independent experiments. * P<0.05; ** P<0.01. The significance marked at the top of the columns refers to comparison with the control group.

