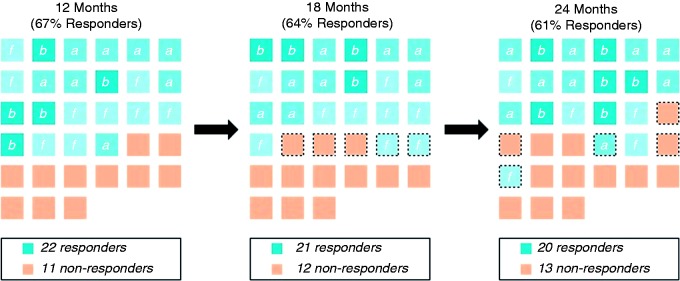
Figure 7.
Therapeutic response to therapy defined as an acute and/or frequency response is consistent over time. At each time point, each square represents an individual patient. Responders are further categorised as acute (a), frequency (f) or both (b). Dotted borders indicate changes in response. The majority of patients maintained a response to therapy, with two patients gaining and three patients losing response between each of the time points evaluated.

