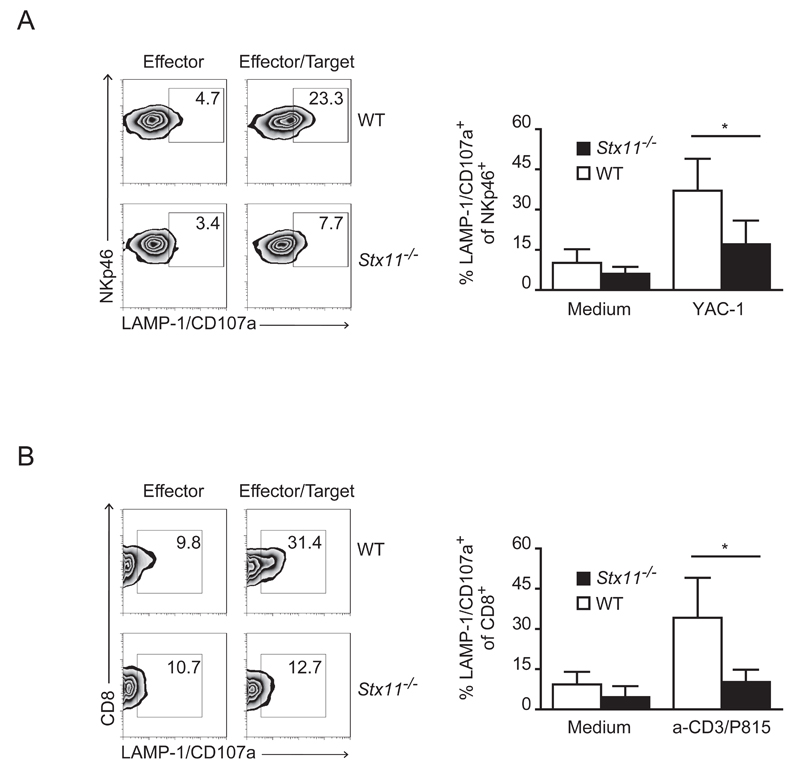
Figure 4. Stx11-/- NK cells and CTLs display defective degranulation.
(A) rhIL-15 treated splenocytes (NKp46+) or (B) CTL (CD8+) cells were incubated alone or with YAC-1 or anti-CD3 presenting P815 target cells respectively (E/T ratio: 10:1). Target cell-induced degranulation was measured by LAMP-1/CD107a surface expression. Values in plots indicate the percentage of gated cells. One representative result out of five (A) or three (B) independent experiments is shown. Histograms report results pooled from all degranulation experiments performed and are shown as mean + SD of 13-14 (A) or 8 different mice of different genotype (B). *= p<0.005. Mann Whitney test was performed.

