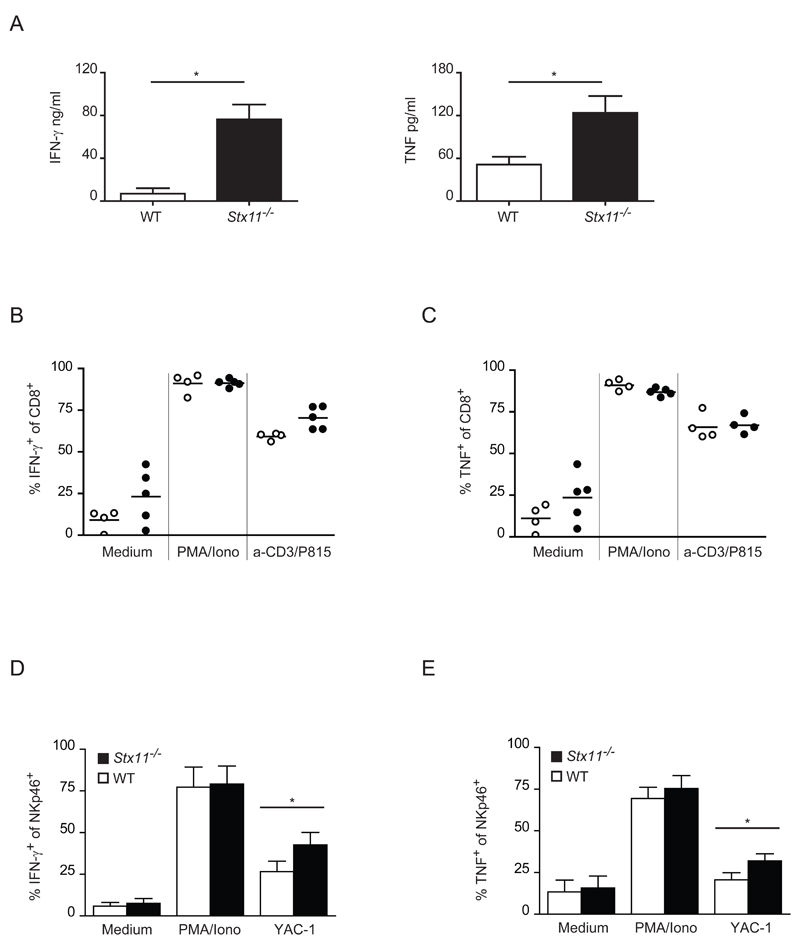
Figure 7. Cytokine production is increased in Stx11-/- CTLs and NK cells.
(A) CTLs were activated upon 4 rounds of stimulation with alloantigenic spleen cells. IFN-γ and TNF levels were measured by ELISA from the cell supernatants collected 5 days after the last stimulation. Results are shown as mean + SD of 6 samples pooled from three different experiments. *= p<0.005. Mann Whitney test was performed. (B, C) CTLs were activated with 3 rounds of anti-allo stimulation and re-stimulated as indicated. Expression of (B) IFN-γ and (C) TNF was assessed by intracellular staining on CD8+ T cells. Open symbols, WT CTLs; filled symbols, Stx11-/- CTLs. Each symbol represents a single sample and data were pooled from three independent experiments. (D, E) Splenocytes activated with rhIL-15 were re-stimulated as indicated. Expression of (D) IFN-γ and (E) TNF was assessed by intracellular staining of NKp46+ cells. Data are shown as mean + SD of 7-9 different mice of different genotype samples pooled from three independent experiments. *= p<0.005. Mann Whitney test was performed.

