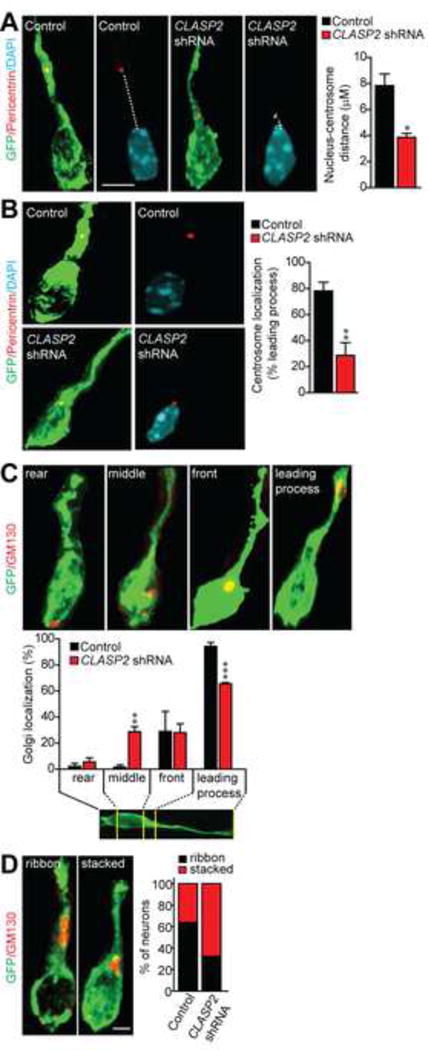
Figure 6. CLASP2 is Necessary for Centrosome-Golgi Localization.

(A–B) Immunostaining for Pericentrin (red) shows centrosome localization and demonstrates a shorter distance between the nucleus and centrosome in CLASP2 knockdown neurons (control, n = 43 cells; CLASP2 shRNA, n = 53 cells). Nuclei were stained with DAPI (blue).
(C–D) Immunostaining for GM130 shows Golgi localization and percentage of neurons exhibiting a ribbon or stacked Golgi phenotype (control, n = 51 cells; CLASP2 shRNA, n = 36 cells). For additional data, see Figure S5.
Data are means ± SEM and statistical significance was assessed using unpaired t test and one-way ANOVA (*p < 0.05, **p<0.001, ***p<0.0001). Scale bar represents 5 μm.
