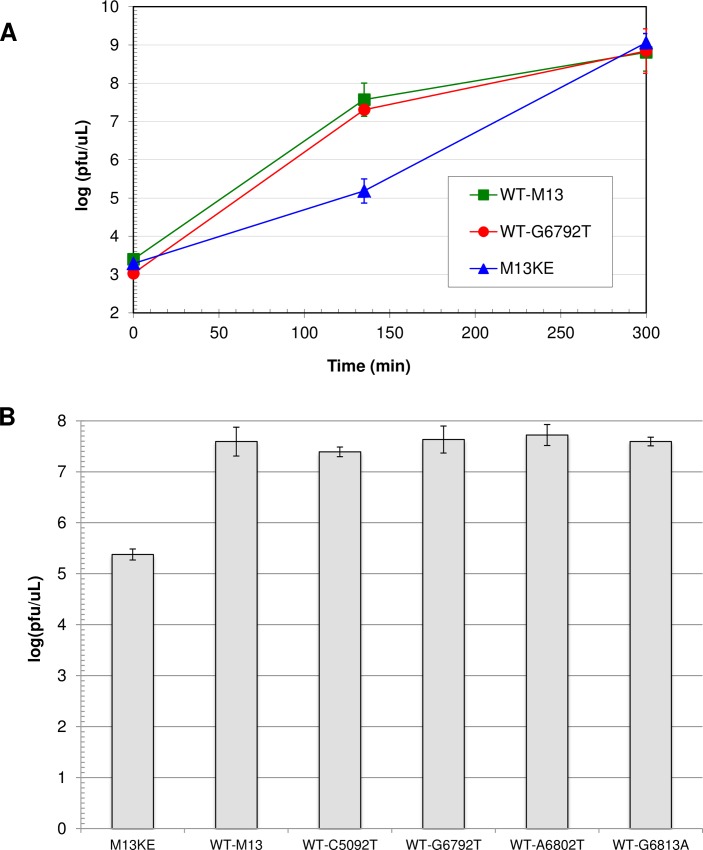
Fig 3. Comparison of propagation rates of wild-type M13 mutants.
(A) Time course for amplification of WT-M13, WT-G6792T, and M13KE. Each phage clone was amplified in three separate early log cultures of E. coli ER2738. From each culture, one aliquot was diluted and plated at the indicated incubation times, and the concentration of phage (pfu/μL) in each growing culture was determined based on plaque counts. Data points represent the mean log(pfu/μL) of the three separate cultures for each type of phage, and the error bars show the 95% confidence interval. Statistical analysis indicated significant differences among the phage concentrations for the three sets of data at 135 minutes (ANOVA; F2,8 = 318.2, P < 0.0001). Post-hoc analysis showed that WT-M13 and WT-G6792T were not significantly different from each other (Tukey’s HSD; α = 0.05, P = 0.0981). Both WT-M13 and WT-G6792T were significantly different from M13KE (P < 0.0001). (B) Phage concentrations of all WT-M13 mutant clones at 135 minutes of incubation. Each phage clone was amplified separately in an ER2738 culture. At 135 minutes, three aliquots from each flask of growing culture were diluted and plated, and the concentration of phage (pfu/μL) was determined based on plaque counts. The M13KE control was run 12 times for a total of n = 36 platings. WT-M13 was run 6 times (n = 18 platings) and all other phage clones were run twice each (n = 6 platings). Each bar represents the mean log(pfu/μL) of all platings for a given clone, and the error bars show the 95% confidence interval. Statistical analysis indicated significant differences among the phage concentrations for all the data sets (ANOVA; F5,77 = 239.3, P < 0.0001). Post-hoc analysis showed that M13KE is significantly different from all the other clones (Tukey’s HSD; α = 0.05, P < 0.0001) and that there is no significant difference between any pair among WT-M13 and the WT-mutant clones (range in P = 0.34–1.00).

