
Fig 3. Grand average ERPs for faces versus Gabors.
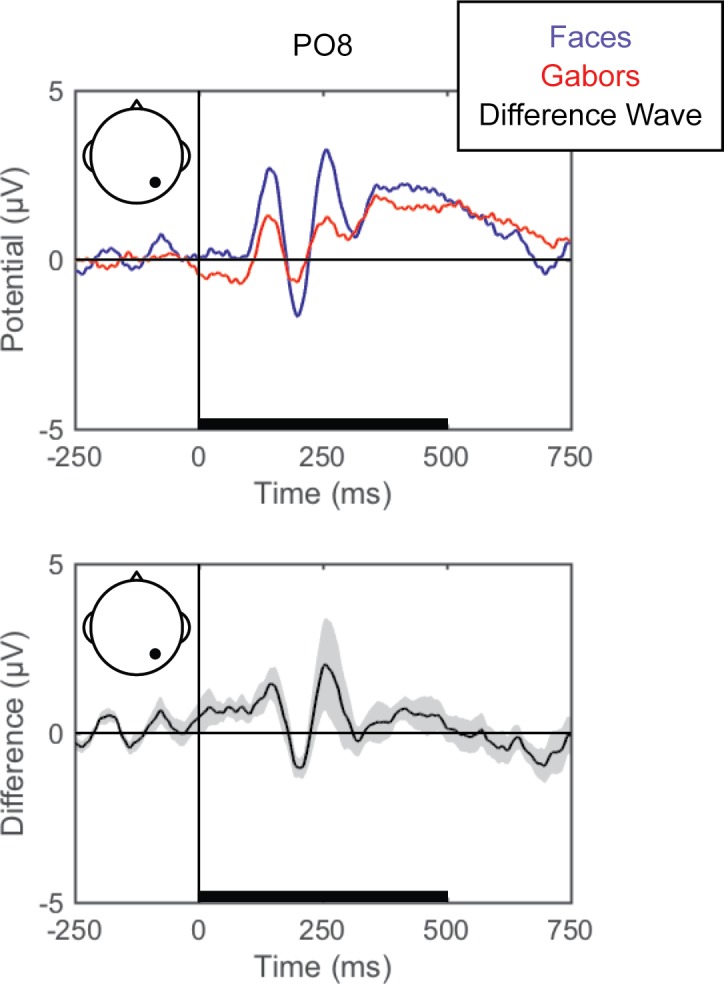
Grand average ERPs are shown for electrode PO8 for face (blue) and Gabor (red) stimuli (top). The difference wave (black) with the within-subjects standard error (gray shading) are plotted (bottom). The black bars on the horizontal axes reflect stimulus duration.