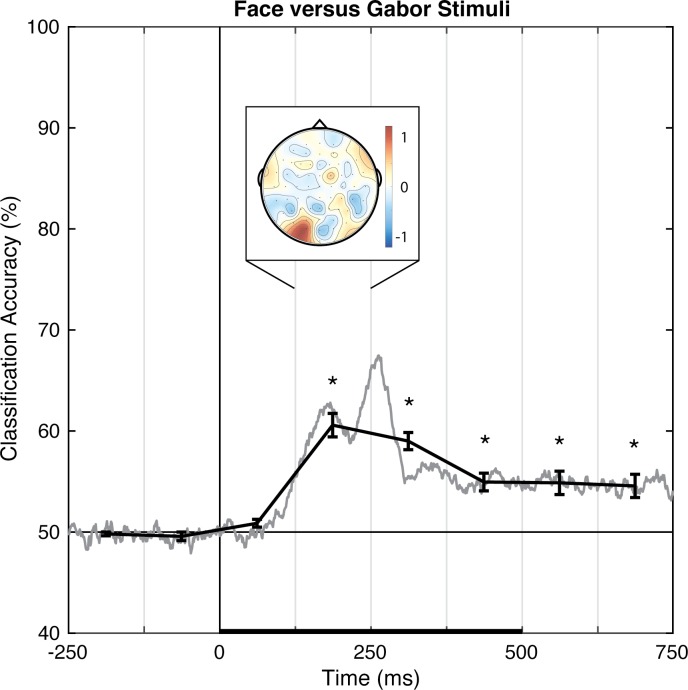
Fig 6. Group classification accuracy for face versus Gabor stimuli.
The gray line shows the group-averaged accuracy at each time point. The black line shows the time-averaged accuracy for each 125-ms time bin, on which inferential statistics were carried out (with within-subject standard errors). For the peak accuracy time bin, the heatmap shows the group-averaged electrode weights across the scalp, also averaged over 125 ms. Chance accuracy is 50% (black horizontal line), and the black horizontal bar on the lower axis reflects stimulus duration. * p < .00625 (Bonferroni-corrected α-level).

