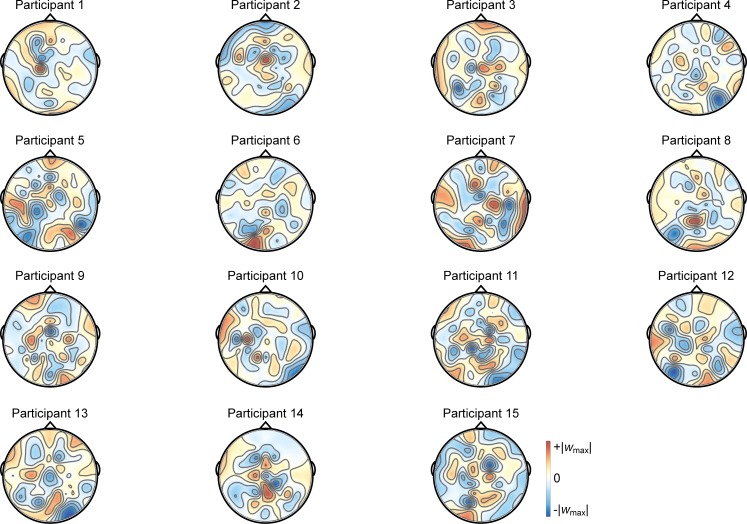
Fig 12. Individual participants’ importance maps for global versus local attention.
The importance maps show each participant’s average weights over the 500–625 ms time bin (the 125-ms time bin showing peak group classification). For each individual, the color scale maximum and minimum are set to the positive and negative absolute maximum weight value, to be symmetric about 0. The most informative electrodes are reflected in intense blue or red, with white as least informative.

