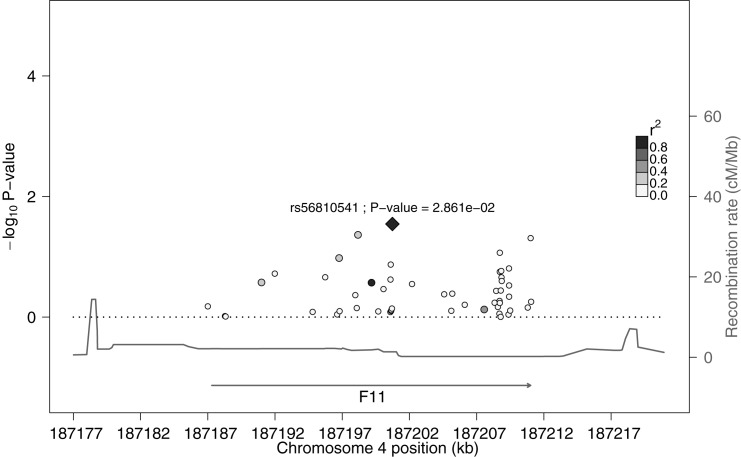
Fig 2. Plot of the association between variants within the F11 locus with plasma FXI levels.
Markers represented common variants organized by genomic position. Tthe diamond-shaped marker represented the top SNP (rs56810541) with the lowest variant-plasma FXI level association p-value. The left axis shows the statistical significance expressed as -log10 of the p-values and colour intensities show the level of linkage disequilibrium between all variants and the top SNP. The recombination rate in the HapMap II sample [33] for this region is measured on the right axis.

