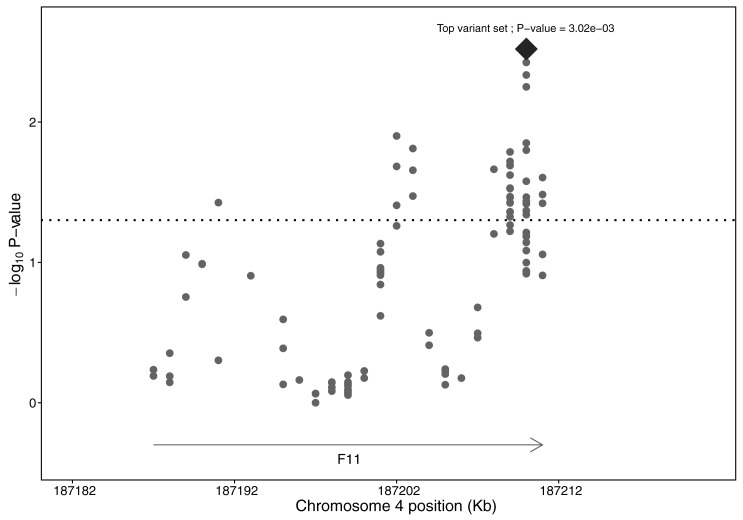
Fig 4. Plot of the collapsing method association in the F11 locus.
Markers represented the mean position of low-frequency variant sets. The diamond-shaped marker represented the top low-frequency variant set and markers located above the dotted horizontal line are the most significant low-frequency variant sets (p-value <0.05). None of the low-frequency variant sets were significantly associated after controlling FWER = 0.05.

