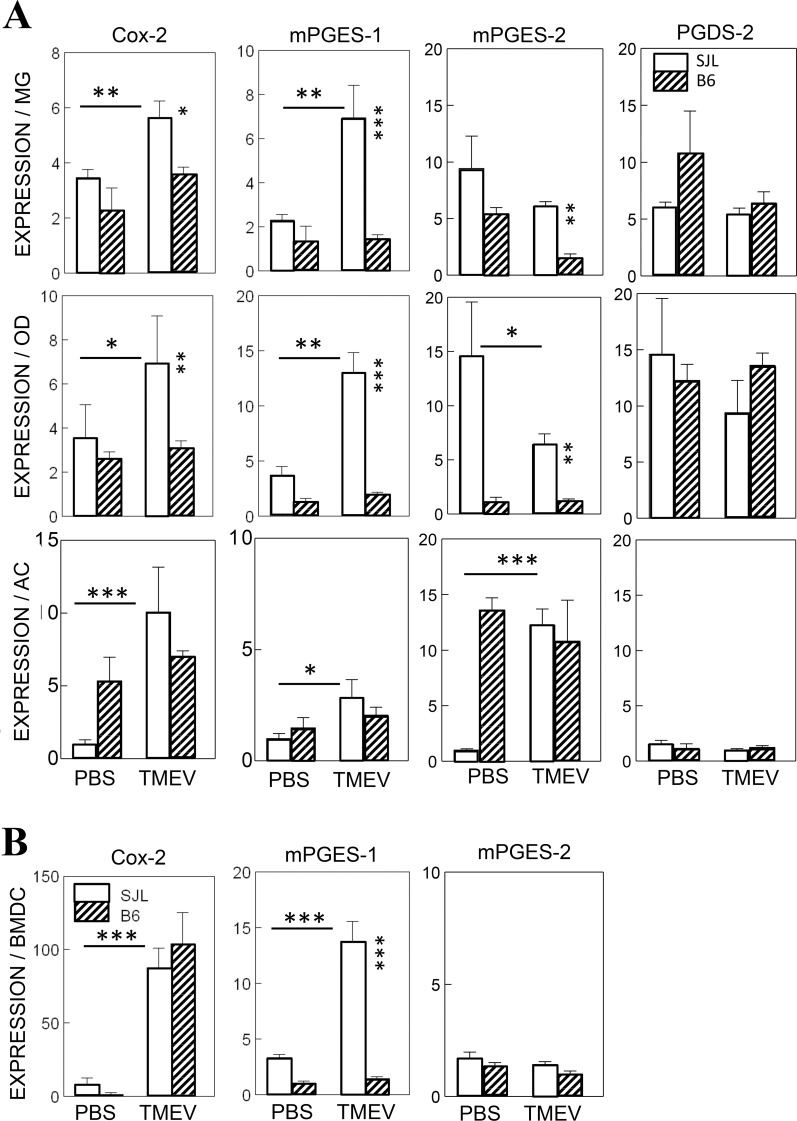
Fig 2. Elevation of COX-2 and mPGES-1 levels in various cells infected with TMEV.
A. The levels of inducible COX-2 and mPGES-1, constitutive mPGES-2 and antagonistic PGDS- 2 in primary microglia, oligodendrocytes and astrocytes derived from B6 or SJL mice were assessed using qPCR after infection with TMEV (MOI = 10) for 24 h. B. The levels of Cox-2, mPGES-1 and mPGES-2 in bone marrow-derived dendritic cells (BMDCs) from resistant B6 and susceptible SJL mice were assessed using qPCR after infection with TMEV (MOI = 10) for 24 h. MOI represents the multiplicity of infection. For the cells derived from SJL mice, 2 μg of RNA and 4 μg of RNA were used for cells derived from B6 mice due to the relative levels of specific mRNAs. The error bars represent standard deviations (SD) of the triplicate samples. Multiple group comparisons were done by a one-way analysis of variance (ANOVA) with Tukey-Kramer post-hoc analysis. *, P < 0.05; **, P < 0.01; ***, p < 0.001.

