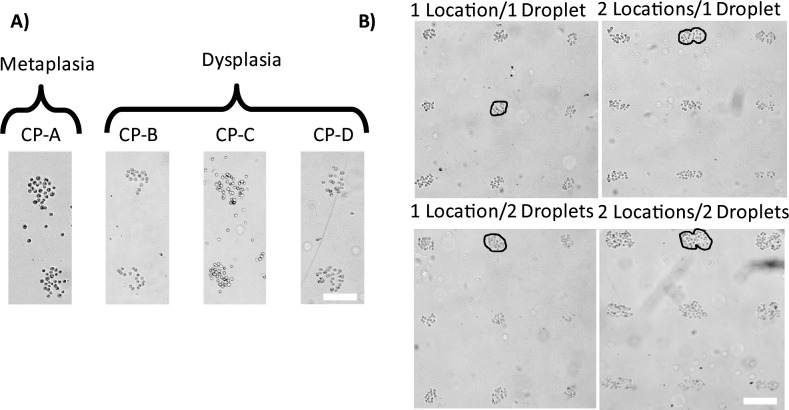
Fig 3. Patterning human esophageal epithelial cell types on substrates deposited with the ECM mixture.
A) The four different cell types (CP-A, CP-B, CP-C, and CP-D) representing the metaplastic and dysplastic stages of premalignant BE progression showed similar population sizes and densities when seeded on custom ECM protein mixture. The micrographs were taken at 15 minutes after seeding. Scale bar 100 μm. B) Small populations of dysplastic (CP-D cell line) BE epithelial cells created using the four different patterning configurations detailed in Fig 4. Simple manipulations of the ECM mixture volume and the spatial arrangement of the deposition locations results in significantly different population sizes and numbers of cells per population. A circle has been drawn on the image to show that there is a difference in number between the cell populations. Custom deposition patterns with varying population sizes can be readily created by varying the distance between the spots and/or volume of the ECM mixture and its local deposition pattern. Scale bar 200 μm.

