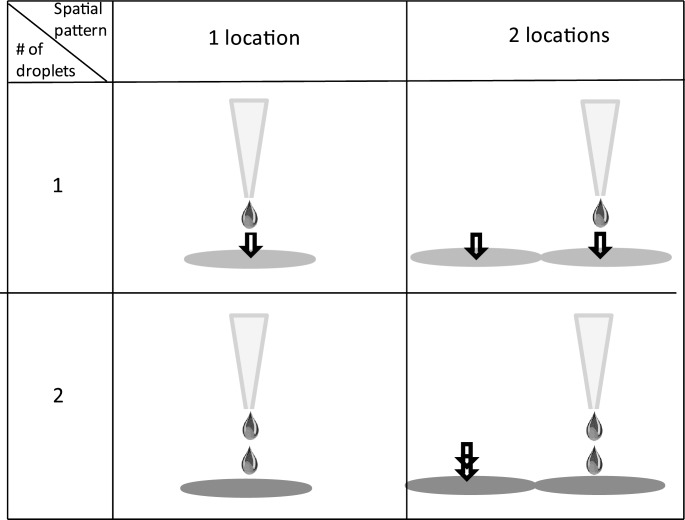
Fig 4. Spatial patterns of ECM mixture deposition used in this study to produce differently sized small populations of cells.
The panels in the first row depict a pattern where one drop (~40 pL volume) of the ECM mixture was deposited on one (upper left) or two adjacent (upper right) locations on the substrate. The bottom two panels represent the same spatial patterns as above, but with two droplets of the mixture being deposited per location.

