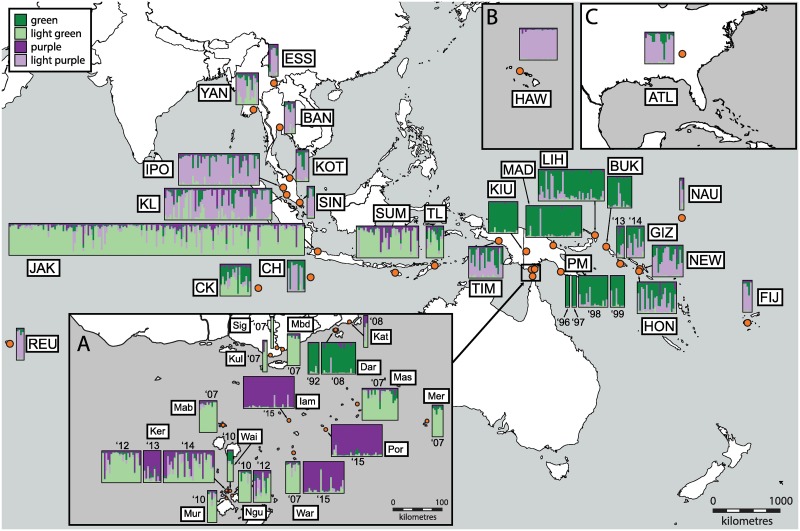
Fig 1. Bayesian STRUCTURE plot (K = 4) for 13 microsatellite loci for 911 samples of Aedes albopictus in the study region.
Each vertical bar in the plots represents an individual sample, where the color of the bar indicates the probability of the individual belonging to a genetic cluster. Samples are positioned on the map corresponding to the population’s location (orange dot) and are abbreviated as in Table 1. Map insets represent the following: A) Torres Strait Islands and Southern Fly Region of Papua New Guinea; B) Hawaii; C) Atlanta. Insets B and C are to scale with the main map scale. The top-left color key shows the color of clusters, as referred to in the main text.

