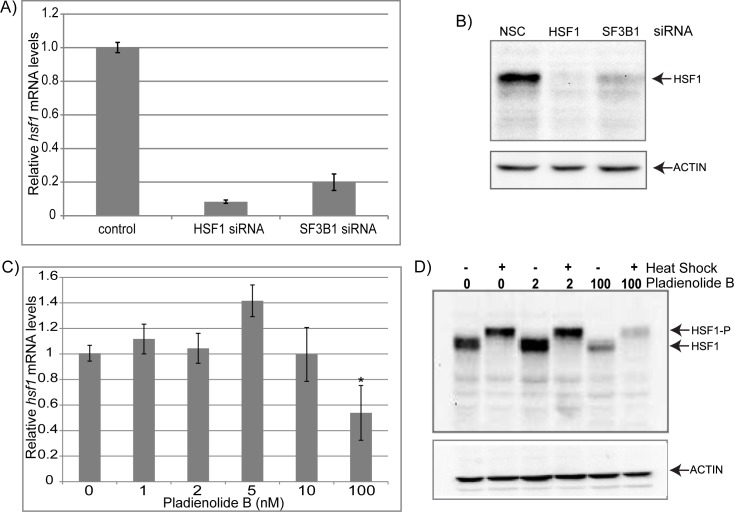
Fig 3. SF3B1 knockdown and high but not low levels of an SF3B1 inhibitor decreases HSF1 mRNA and protein levels.
(A) qRT-PCR analysis of HSF1 mRNA levels in cells that have been treated with either HSF1 siRNA or SF3B1 siRNA relative to nonsilencing siRNA control cells. (B) Western blot analysis of cells that have been treated with non-silencing control siRNA (NSC), HSF1 siRNA, or SF3B1 siRNA and probed with either anti-HSF1 or anti-ACTIN antibodies. (C) qRT-PCR analysis of HSF1 mRNA levels in cells that have been treated with varying amounts of Pladienolide B relative to control cells. (D) Western blot analysis of cells that have been treated with varying amounts of Pladienolide B, with and without heat shock at 42° for 1 hour and probed with either anti-HSF1 or anti-ACTIN antibodies.

