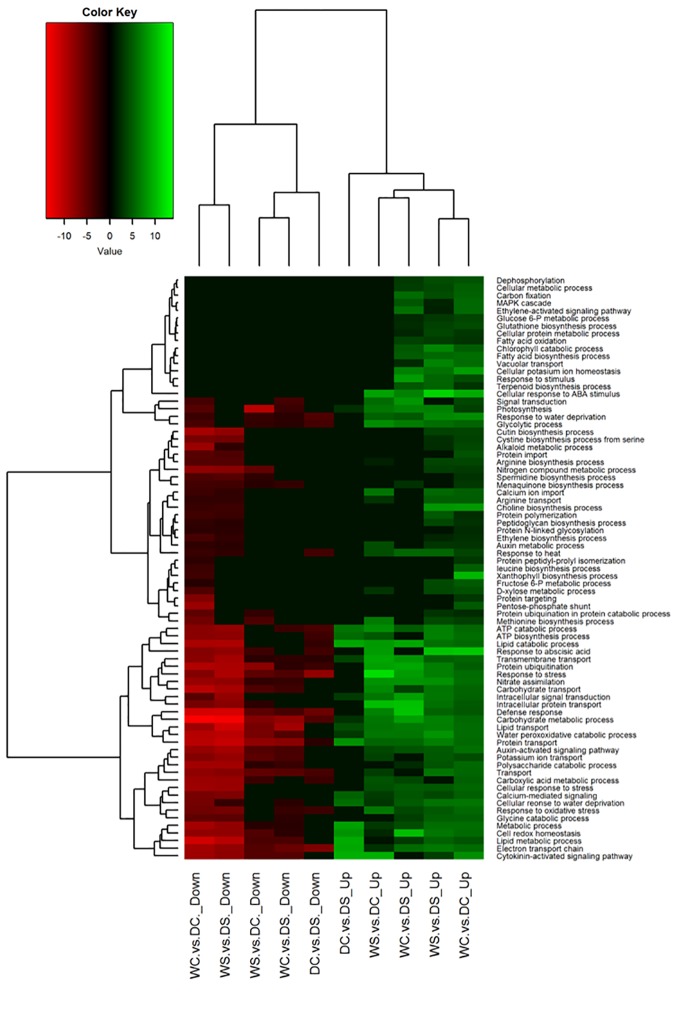
Fig 5. Heat map with clusters for differentially expressed (DE) genes at log2 fold scale in creeping bentgrass.
These DE genes were exposed to the following experimental treatments. WS = watered plants treated with spermidine (Spd); WC = watered control plants (no Spd); DC = drought treated control plants (no Spd); DS = Drought plants treated with Spd. The dendrogram on the top was divided into two parts by representing up- or down- regulation of the genes under each type of treatment comparisons. The dendrogram on the left was separation of different biological processes under different type of treatment comparisons. The bottom scale is pairs of different treatment comparisons.

