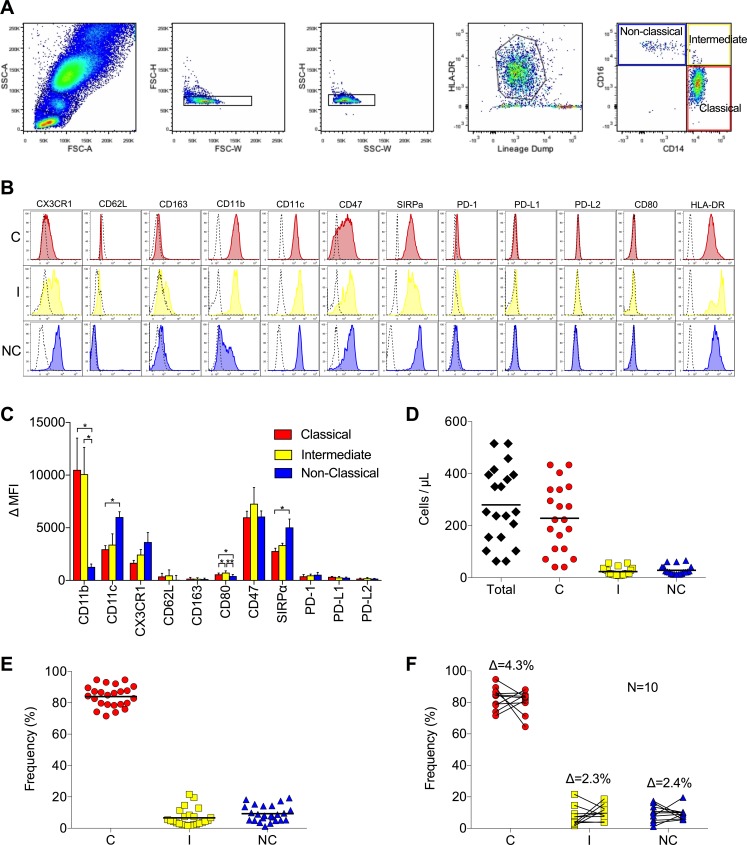
Fig 1. Monocyte phenotyping reveals tightly controlled distribution of subsets.
(A) Gating strategy for phenotyping human monocyte subsets, including (from left to right) size discrimination, doublet exclusion, selection of HLA-DR+lin− cells, and separation according to expression of CD14 and CD16. (B) Representative histograms of cell surface markers on monocyte subsets from one of 25 healthy subjects phenotyped (C = classical, I = intermediate, NC = non-classical). Classical monocytes (red), intermediate monocytes (yellow), and non-classical monocytes (blue) are shown overlaid on negative controls (dashed). (C) Mean expression (±SD) of surface markers on all subjects phenotyped. (D) Absolute numbers of total (black), classical (red), intermediate (yellow), and non-classical monocytes (blue) in circulation (bar = mean). (E) Frequency of each subset as a percentage of total circulating monocytes. (F) Change in the frequency of each subset in each of 10 subjects re-phenotyped 4–6 months following initial phenotyping. The average change in frequency (Δ) of each subset is shown.

