Figure 2.

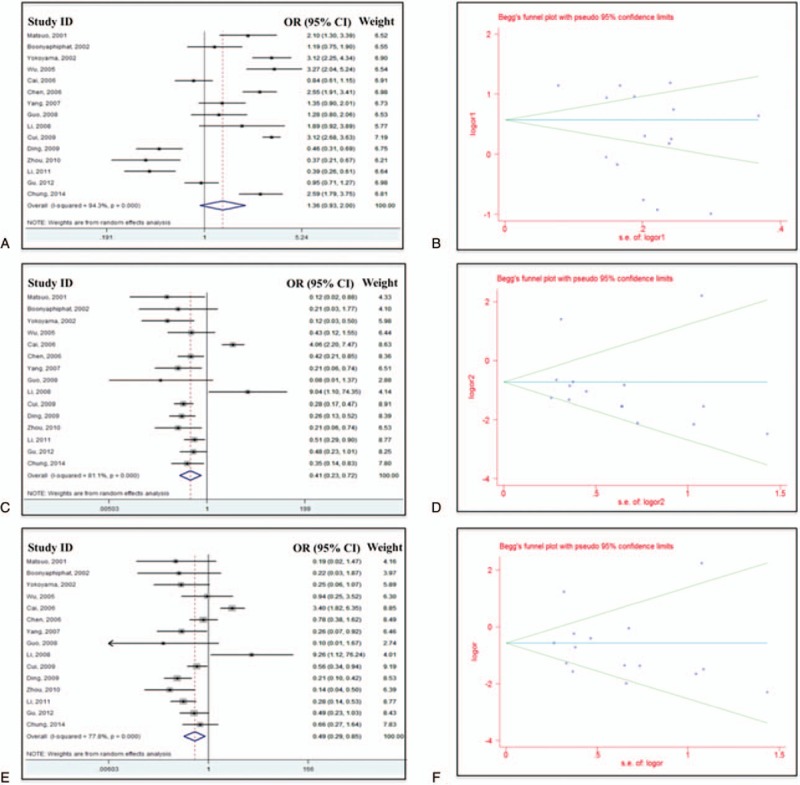
Forest plots (A, C, and E) and Begg funnel plot (B, D, and F) for all studies under dominant model (A and B), recessive model (C and D), and homozygote model (E and F).

Forest plots (A, C, and E) and Begg funnel plot (B, D, and F) for all studies under dominant model (A and B), recessive model (C and D), and homozygote model (E and F).