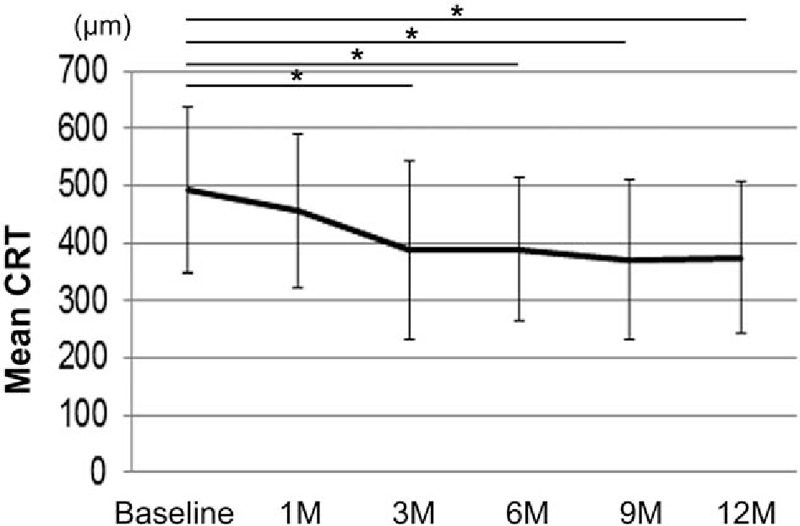
Figure 3.

Mean CRT after intravitreal ranibizumab injection. The mean CRT at each time point is shown. Mean CRT was significantly improved at 3, 6, 9, and 12 months compared with baseline measurements, based on a linear mixed-effects model. Values represent the mean ± SD. ∗P < .05. CRT = central retinal thickness, SD = standard deviation.
