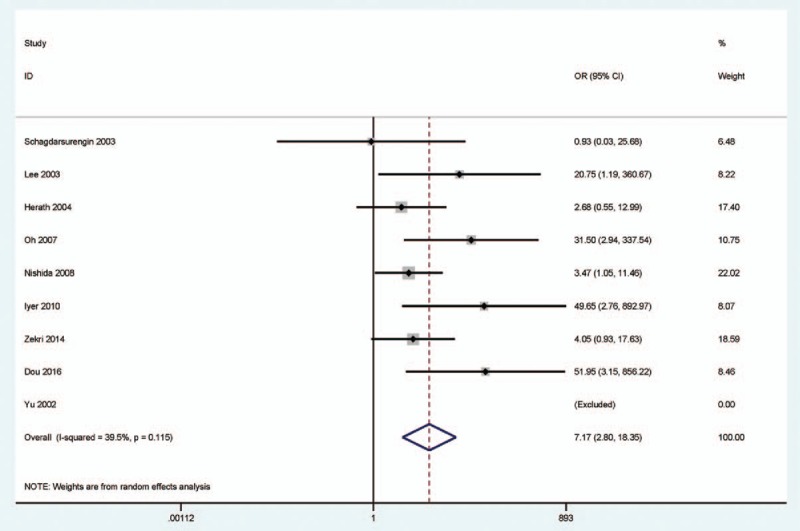
Figure 4.

Forest plot for the relationship of CDH1 hypermethylation status from 9 studies showing the pooled OR under a random-effects model in 494 HCC versus 166 normal samples, OR = 7.17, 95% CI = 2.80 to 18.35. CDH1 = E-cadherin, CI = confidence interval, HCC = hepatocellular carcinoma, OR = odds ratio.
