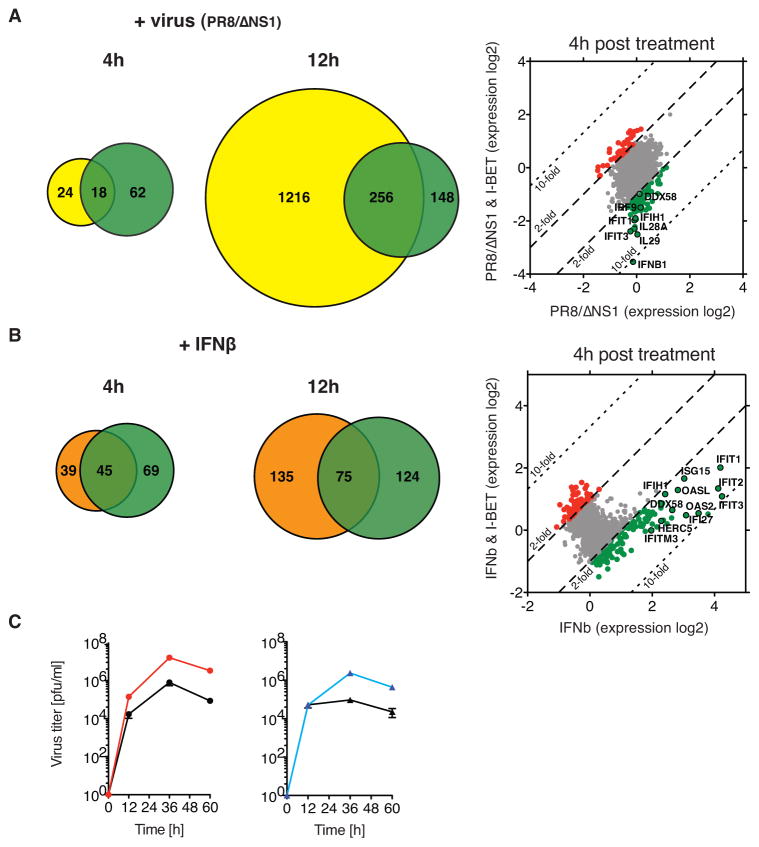
Figure 3. I-BET suppresses the antiviral response.
A. Venn diagrams display the number of virus-induced genes (> 2-fold, yellow circle) that were suppressed (> 2-fold, green circle) by I-BET treatment of A549 cells at 4 hours or 12 hours after infection with influenza PR8/ΔNS1. The scatter plot shows gene expression levels in control (x-axis) versus I-BET-treated cells (y-axis) at 4 hours after infection. The down- or up-regulated genes are shown in green or red, respectively. A black circle highlights genes that play an important role in antiviral response. The broken black line indicates a 2-fold change in expression; the dotted black line indicates a 10-fold change in expression. B. Venn diagrams display the number of IFNβ-induced genes (> 2-fold, orange circle) that were suppressed (> 2-fold, green circle) by I-BET treatment of A549 cells at 4 hours or 12 hours after incubation with IFNβ. The scatter plot shows gene expression levels in control (x-axis) versus I-BET-treated cells (y-axis) at 4 hours after IFNβ treatment. The down- or up-regulated genes are shown in green or red, respectively. A black circle highlights examples of genes that play an important role for the cellular antiviral response. The broken black line indicates a 2-fold change in expression; the dotted black line indicates a 10-fold change in expression. C. I-BET increases virus growth in vitro. The kinetics of influenza PR8/ΔNS1 virus replication in control (black circle) or I-BET-treated A549 cells (red circle) has been measured as described (Marazzi et al. 2012). The viral replication in I-BET treated cells was compared to viral replication in Paf1-deficient A549 cells (blue triangle) that display significant increase in viral replication as compared to control cells (black triangle).

