Figure 2.

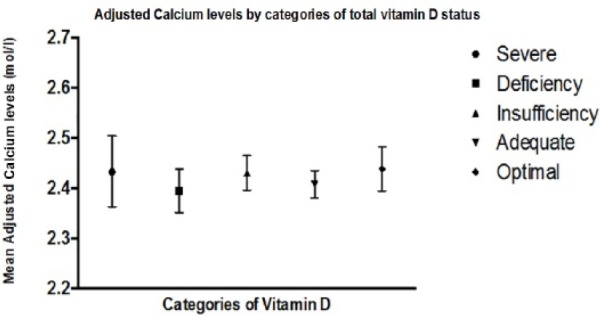
Plot to demonstrate no difference in calcium levels by categories of total 25-hydroxyvitamin D status in men and women aged ≥70 years.
Note. Plot shows means with interquartile ranges.

Plot to demonstrate no difference in calcium levels by categories of total 25-hydroxyvitamin D status in men and women aged ≥70 years.
Note. Plot shows means with interquartile ranges.