
Figure 2.
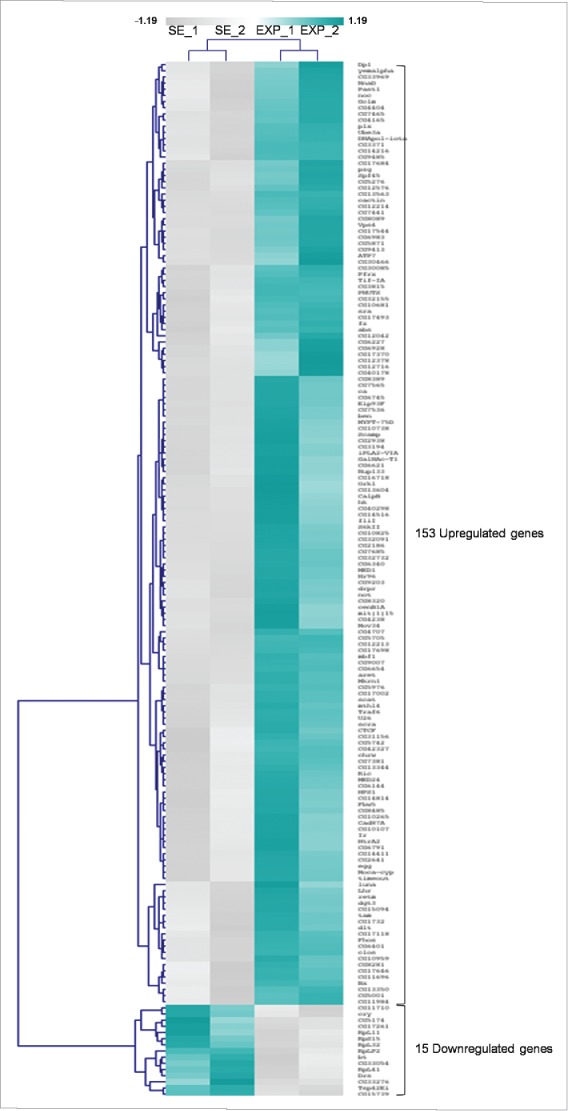
Mobile-phone radiation alters gene-expression profiling mainly through a transcriptional activation process: a genome-wide approach in fly ovary. Heat-map showing normalized expression levels of 168 identified DEGs (≥1.25 fold, P < 0.05), after application of a microarray-based technology, with their (DEGs) vast majority following an upregulated pattern of expression (compared with control conditions), in response to RF-radiation exposure. Gene-clustering was performed using Euclidean distance and average linkage-analysis software. Light-blue color indicates genes with upregulated levels of expression (153), while gray color specifies genes with downregulated levels of expression (15). SE: Sham Exposed. EXP: Exposed (truly). N = 2, n = 2. N: number of biological samples; n: number of biological experiments. *: P < 0.05.