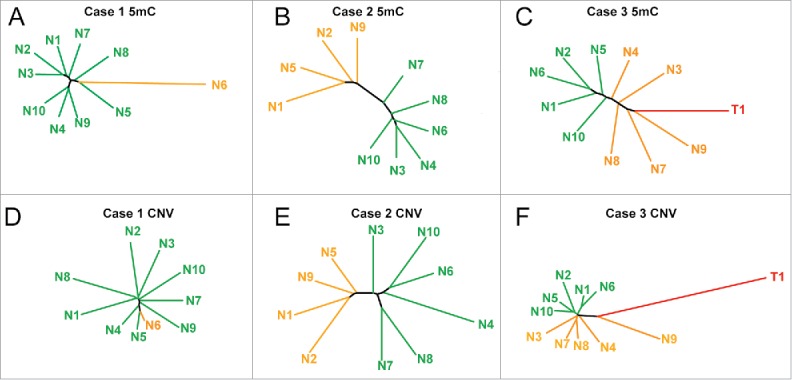
Figure 3.

Phylogenetic trees based on DNA methylation landscapes and copy number variation. (A-C) Phylogenetic trees from the top 5,000 most variable 5mC sites from cases 1–3. (D-F) Phylogenetic trees from chromosomal aberrations identified in cases 1–3. Distinct groups and unique samples are labeled orange, with the remaining regenerative nodules in green, and the tumor for case 3 in red. Individual branches are color coded in the same manner as the dendrograms in Fig. 2.
