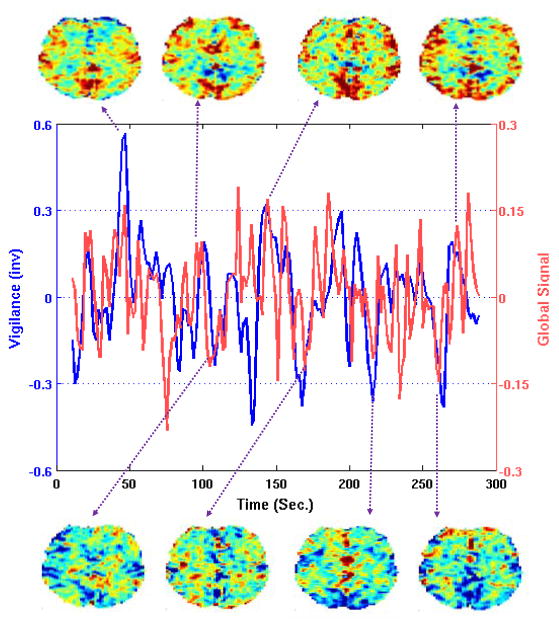
Figure 4.
Global signal (green) is negatively correlated with EEG vigilance time course (blue; inverted for display) over the course of a scan. Examples of images that occur near vigilance peaks (and valleys in the global signal) are shown below the plot, while images that occur near vigilance valleys (and peaks in the global signal) are shown above the plot.

