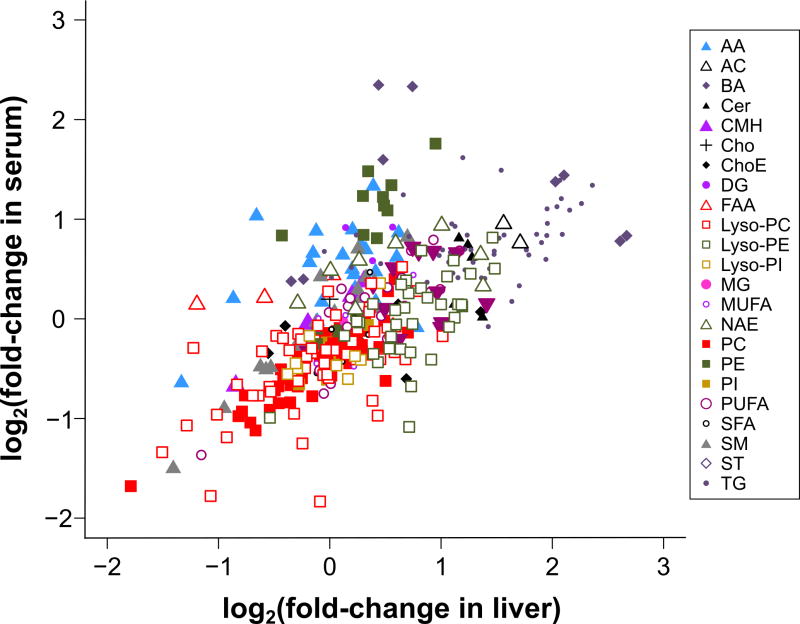
Figure 3. The serum metabolomic profile reflects hepatic metabolism.
Comparison of liver and serum metabolomics profiles of MAT1A-KO mice. Each point represents the log2(fold-change) of individual metabolic ion features of MAT1A-KO compared to WT mice in serum and liver. A list with the log2(fold-change) and P-value for each individual metabolite in serum and liver is given in supplementary Table 1. R2=0.45, P=1E-04. AA, amino acids; AC, acyl carnitines; BA, bile acids; Cer, ceramides; CMH, monohexosylceramides; Cho, cholesterol; ChoE, cholesteryl esters; DG, diglycerides; FAA, fatty acyl amides; PC, phosphatidylcholines; Lyso-PC, lyso- phosphatidylcholines; PE, phosphatidylethanolamines; Lyso-PE, lyso-phosphatidylethanolamines; PI, phosphatidylinositols; Lyso-PI, lyso-phosphatidylinositols; MG, monoglycerides; SFA, MUFA and PUFA, saturated, monounsaturated and polyunsaturated fatty acids, respectively; NAE, N-acylethanolamines; SM, sphingomyelins; ST, steroids; TG, triglycerides.

