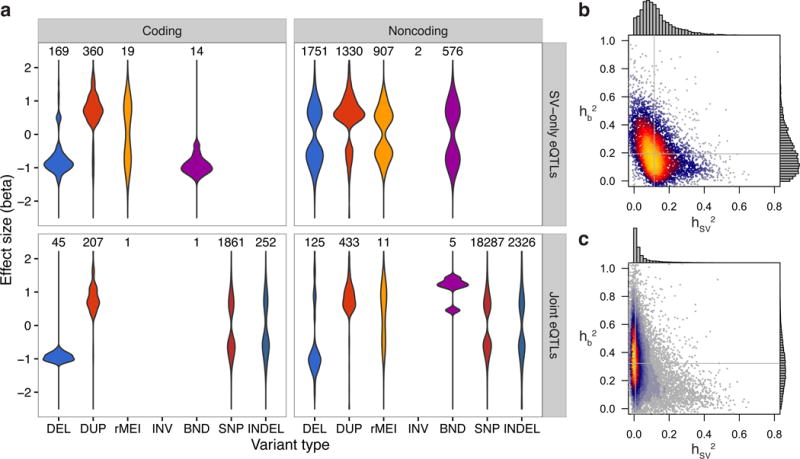
Figure 2.

eQTL effect size distributions and heritability partitioning with linear mixed models. (a) Effect size distributions for coding and noncoding variants of each type, with the number of eQTLs of each type above each distribution. The top panels (SV-only eQTLs) show the 5,128 eQTLs that were discovered by the SV-only analysis, while the bottom two panels show the 23,554 eQTLs discovered by the joint analysis. The “DUP” category includes duplications and mCNVs, and the alternate allele for rMEIs is the insertion. (b,c) Heat scatter plots showing the heritability of each eQTL apportioned to the most significant SV in the cis window (x-axis) and the additive effect from the top 1,000 most significant SNVs and indels in the cis window (y-axis) for (b) SV-only and (c) joint eQTL mapping analyses. Gray lines denote the median of values for each axis.
