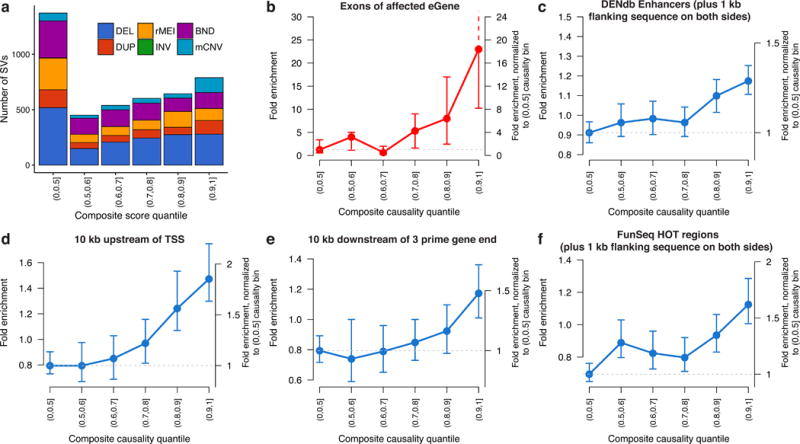
Figure 3.

Feature enrichment of SV-eQTLs. Fold enrichment and 95% confidence intervals (based on 100 random shuffled sets of the positions of SVs in each bin) for the overlap between the most significant SV and various annotated genomic features at the union of eQTLs discovered by SV-only or joint eQTL mapping. (a) Composition of each causality score bin by SV type. (b) Enrichment for an SV in each bin of causality to touch exons of the affected eGene. For the remaining plots in blue (c-f), SVs that overlapped with an exon of their affected eGene were excluded, yet the remaining SVs still showed significant enrichment in (c) enhancers from the Dragon Enhancers Database (DENdb), (d) in the 10 kb regions upstream and (e) downstream of transcriptions start sites (TSS), and (f) regions predicted to be highly occupied by transcription factors (FunSeq HOT regions).
