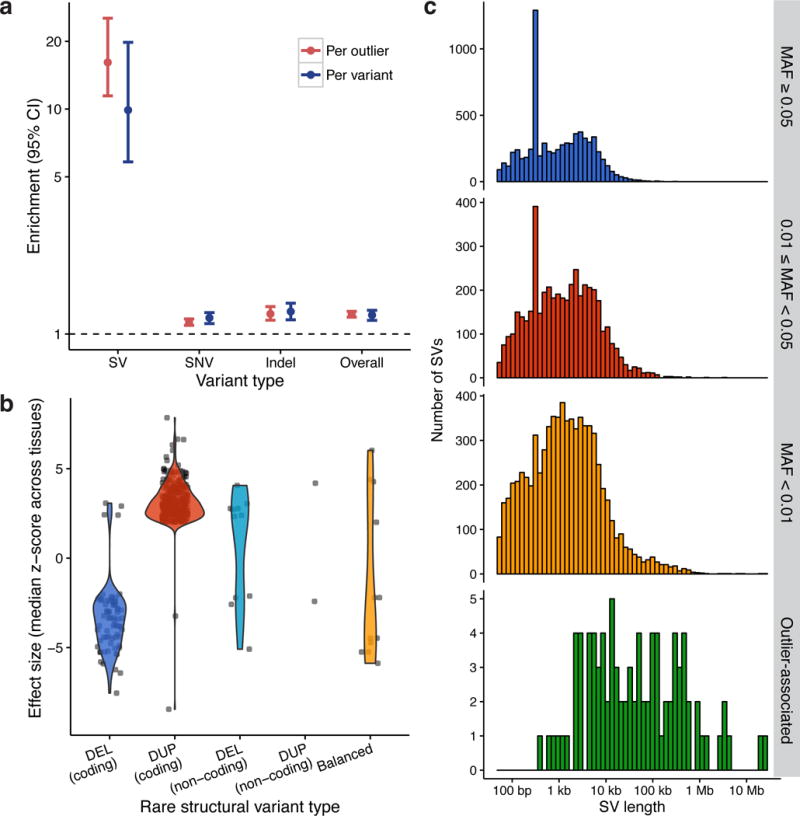
Figure 5.

Gene expression outliers are associated with rare SVs. (a) Fold enrichment of rare variants within 5 kb of expression outliers (red) and fold enrichment of outliers within 5 kb of rare variants (blue) between the observed set of 5,047 outliers and 1,000 random permutations of their sample names (y-axis is log-scaled). (b) Effect size distributions for each SV type within 5 kb of an outlier in the same individual, with “coding” SVs defined as those that overlap with exons of the outlier gene and “noncoding” defined by the remainder. (c) Size distribution histograms by minor allele frequency (MAF) classes and rare SVs within 5 kb of an expression outlier in the same individual, excluding balanced rearrangements. A peak at ~300 bp in the top two plots results from Alu SINE insertions in the reference genome.
