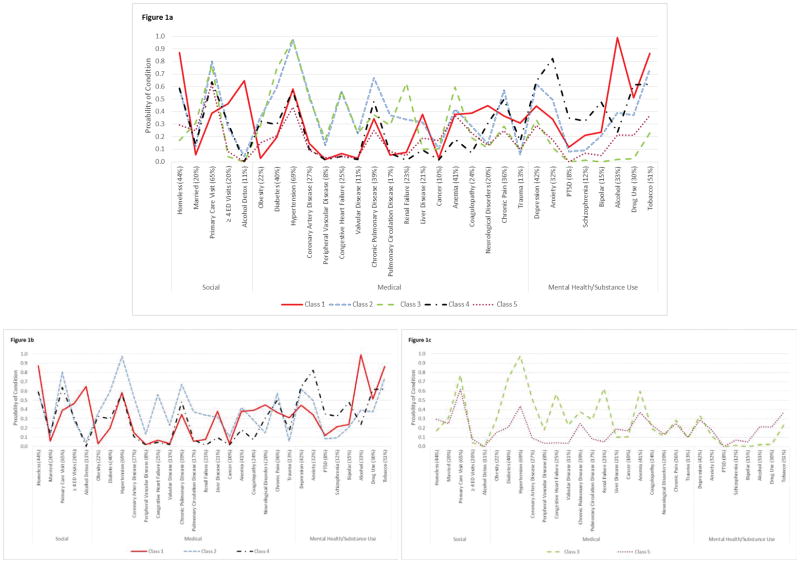
Figure 1. Probability of Social, Medical and Mental Health/Substance Use Indicators by 5 Latent Classes.
1a. The estimated probability (Y axis) for each indicator variable (X axis) in the latent class analysis is shown for each of the 5 classes. On the horizontal axis, the overall sample prevalence for each indicator is given (%) and the indicators are grouped by social, medical, and mental health/substance use. The separate lines demonstrate how the classes differ across the indicators and provide information on which indicators are more prevalent for each of the 5 classes. 1b and 1c presents the same data but separates it by the high homelessness classes (1b) and the primarily medical classes (1c).

