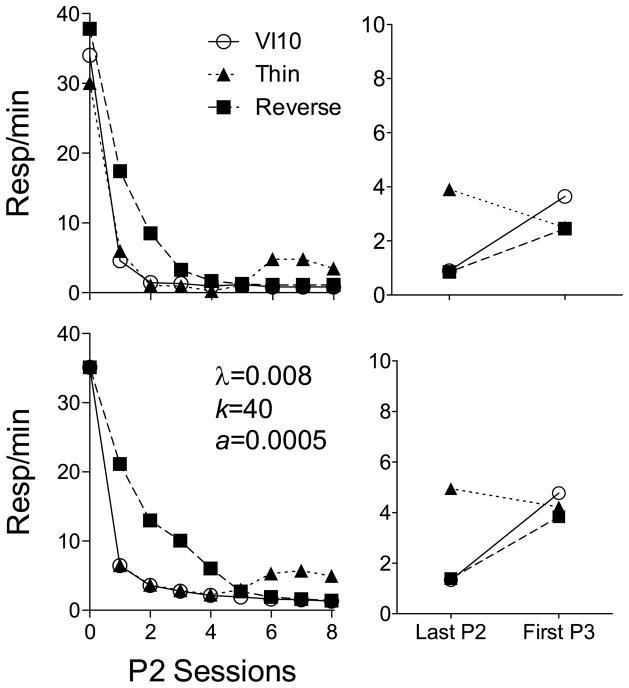
Fig. 15.
The top panels show data from Schepers and Bouton (2015, Experiment 2) in Phase 2 (left) and Phase 3 (right). The bottom panels show a simulation generated by RaC. Last P2 and First P3 refer to the last session of Phase 2 and the first session of Phase 3, respectively.

