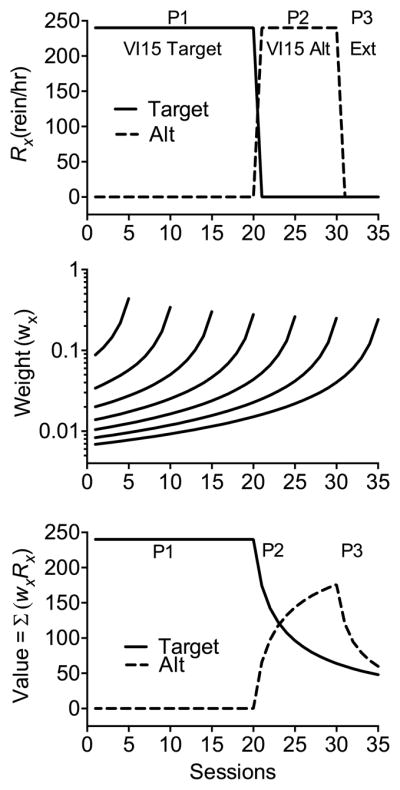
Fig. 2.

The top panel shows arranged reinforcement rates for the target and alternative options in a sample resurgence experiment. The middle panel shows sample weighting functions as in Fig. 1. The bottom panel shows the value functions for the target and alternative options across sessions resulting from the application of Eq. (8). P1 = Phase 1, P2 = Phase 2, and P3 = Phase 3.
